by Łukasz Piątkowski on Jul 24, 2020

An in-depth series on how to easily get centralized logging, better security, performance metrics, and authentication using a Kubernetes-based platform.
Introduction
In this four-part blog series, we’ll give you a tutorial on how to create a microservice-oriented application from scratch, as well as how to deploy and run it using the cloud-native stack. In the first part, we talked about setting up the development environment. In the second part, we implemented our application in Golang. In the third part, we explained how we can use Helm and Helm charts to deploy the application.
Now, it’s time to see our cloud-native platform in action with all the nice features we promised.
Quick verification
Last time we deployed our application. Now, let’s try to test it and check if it works as we expected. As we have no dedicated client for our ToDo application, we’ll use the curl command to talk to our HTTP API endpoint. But first, we need to start port-forwarding to the apiserver service:
kubectl -n todo port-forward service/apiserver 8080
Now let’s run:
$ curl http://localhost:8080/v1/todo
null
We didn’t get any response, but that’s expected: we haven’t created any ToDo entries yet. Let’s create some:
$ curl -H "Content-Type: application/json" -X POST \
-d '{"Text":"Check grafana"}' \
http://localhost:8080/v1/todo
{"id":"1","text":"Check grafana","done":false}

$ curl -H "Content-Type: application/json" -X POST \
-d '{"Text":"Check loki"}' \
http://localhost:8080/v1/todo<
{"id":"2","text":"Check loki","done":false}
Now, let’s fetch all ToDos again:
$ curl http://localhost:8080/v1/todo
[{"id":"1","text":"Check grafana","done":false},{"id":"2","text":"Check loki","done":false}]
It works! 🎉 Now let’s see how the tools provided by the cloud-native stack we installed make our management of the application easier.
We'll start with Linkerd. If you have terminated port-forwarding for Linkerd, start it again:
kubectl -n linkerd port-forward service/linkerd-web 8084
To see our tools in action, we need to have some live traffic hitting our ToDo service. You can either fire them manually like the GET request above repeated a few times or launch a simple bash loop that sends a GET request every 100 ms:
while true; do curl http://localhost:8080/v1/todo; sleep 0.1; done
Next, head to http://localhost:8084/namespaces. What we should get immediately in the namespace dashboard are statistics for the number of total requests (both HTTP and gRPC) executed in our namespace:
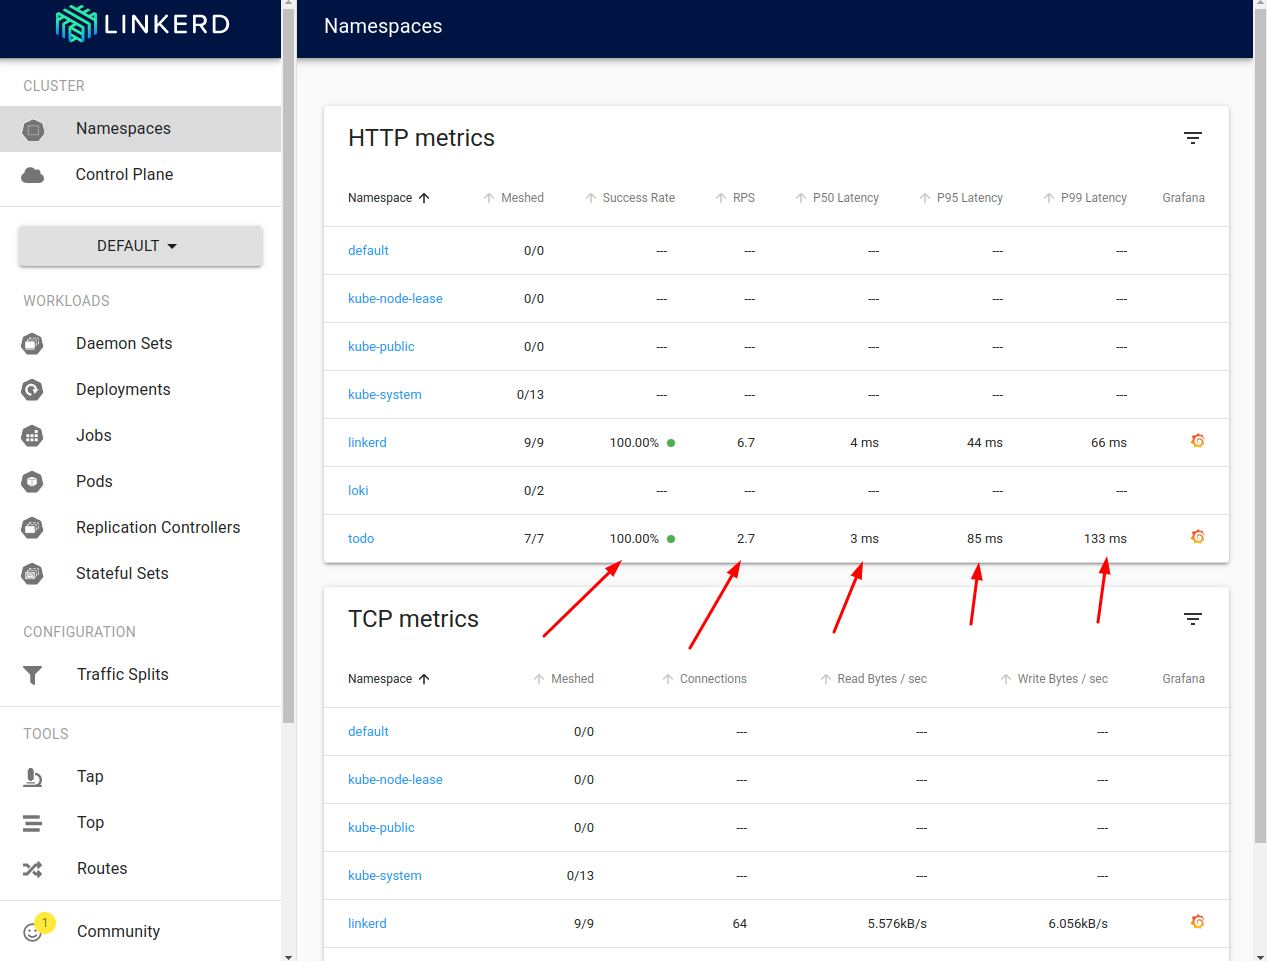
We can see how many of the requests are successful, how many requests per second we are handling (RPS), and what are the 50th, 95th, and 99th percentile of the latency distribution. Let’s click the namespace name to get more specific data.
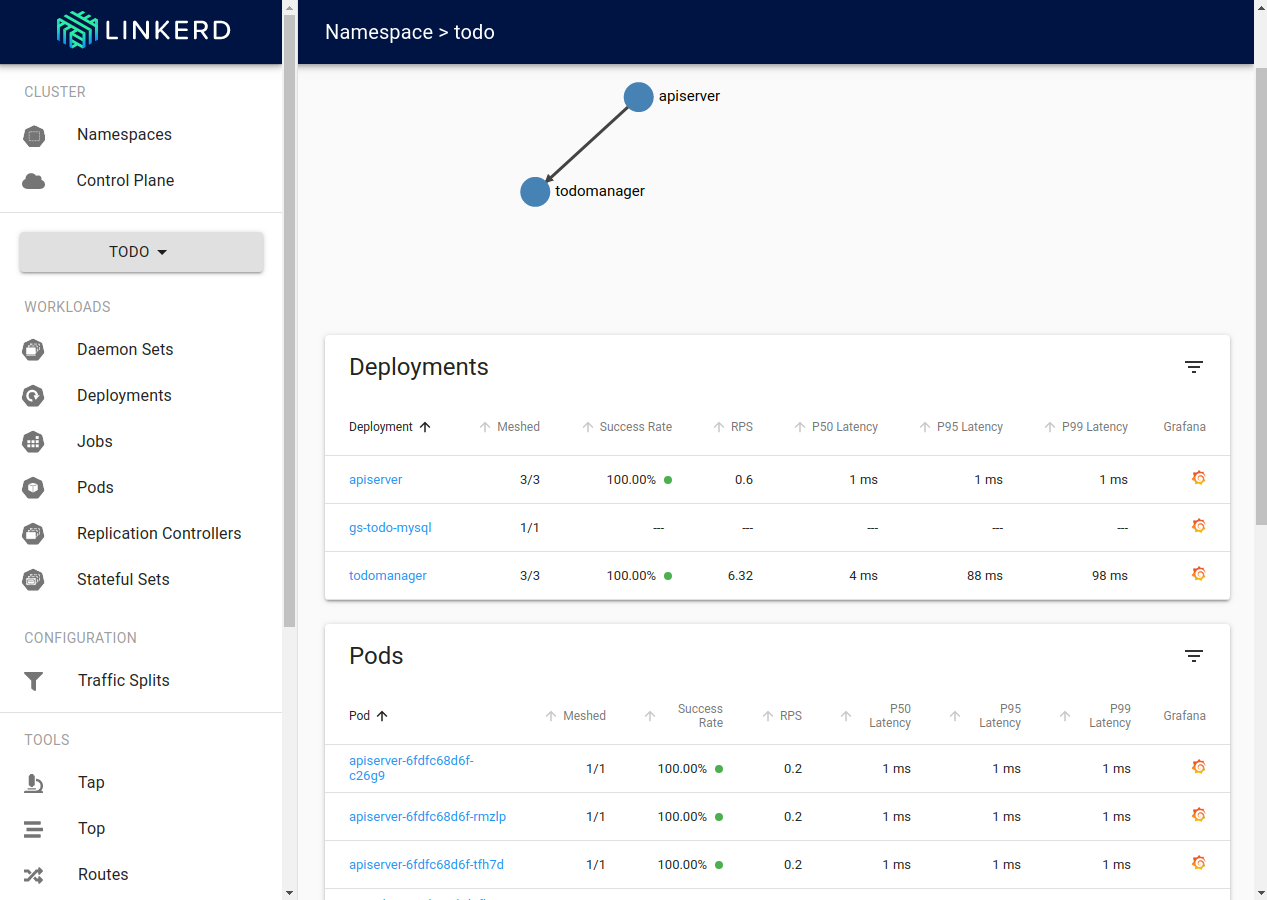
Here we can see the same statistics, but available on the per-deployment and per-pod level. Additionally, service discovery results in an automatically provided request routing topology is visible at the top of the screen.
The dashboards above show the “live” data about our application. But can we see historical data as well? Sure, just click the Grafana logo in the rightmost column of the entry you’re interested in.
For example, for the “todomanager” deployment it looks like this:
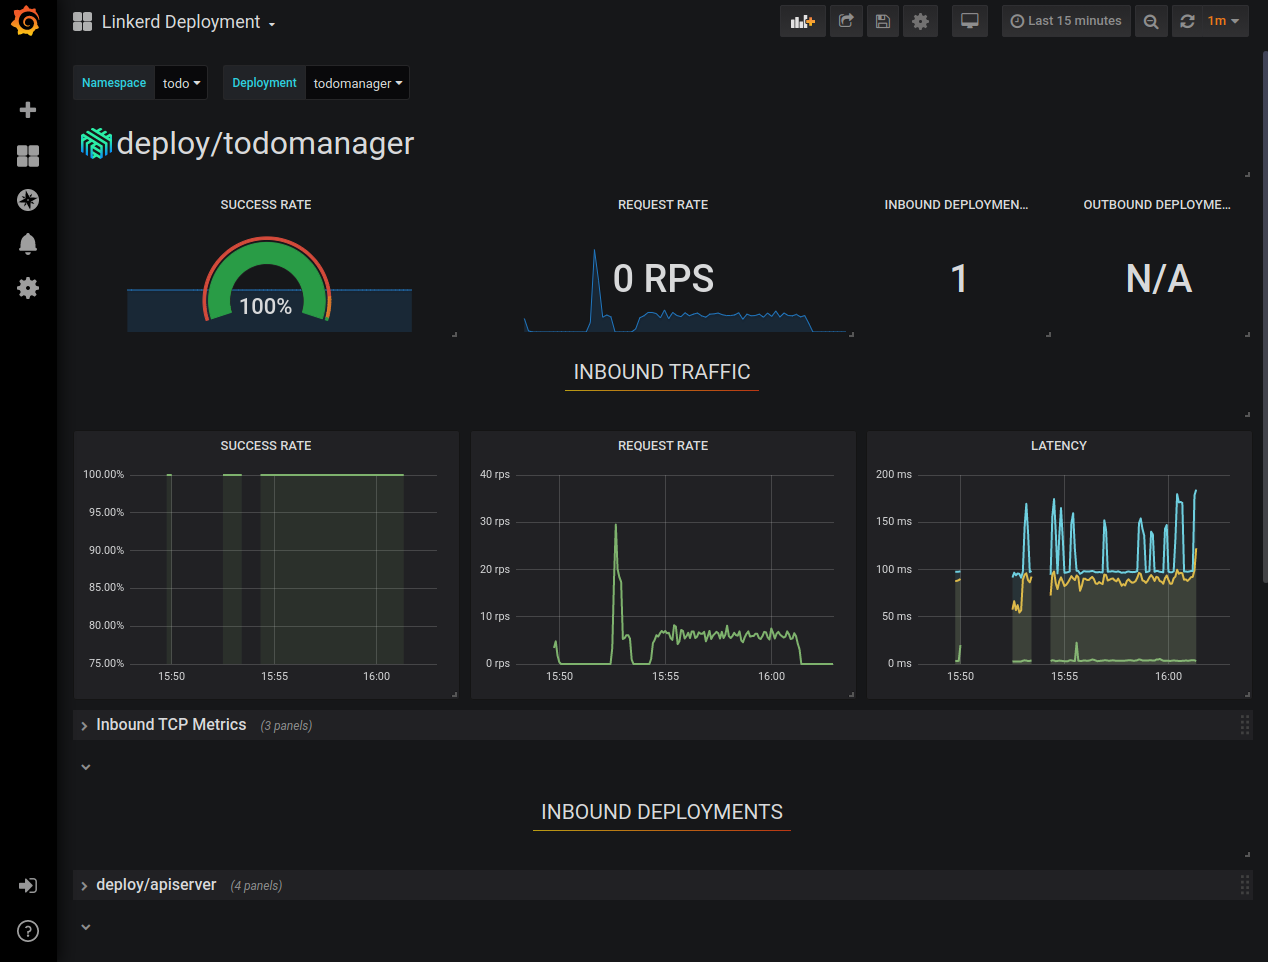
This way, you can already see historical data about the success rate, request rate, and latency distribution of your application. And the best thing is that we had to write no code to make it work, it’s all done by proxies injected by Linkerd. You can stay in the Grafana UI and explore our app some more, but we still don’t see any logs.
In Grafana’s left-side menu go to the “explore” menu we already visited when setting it up.
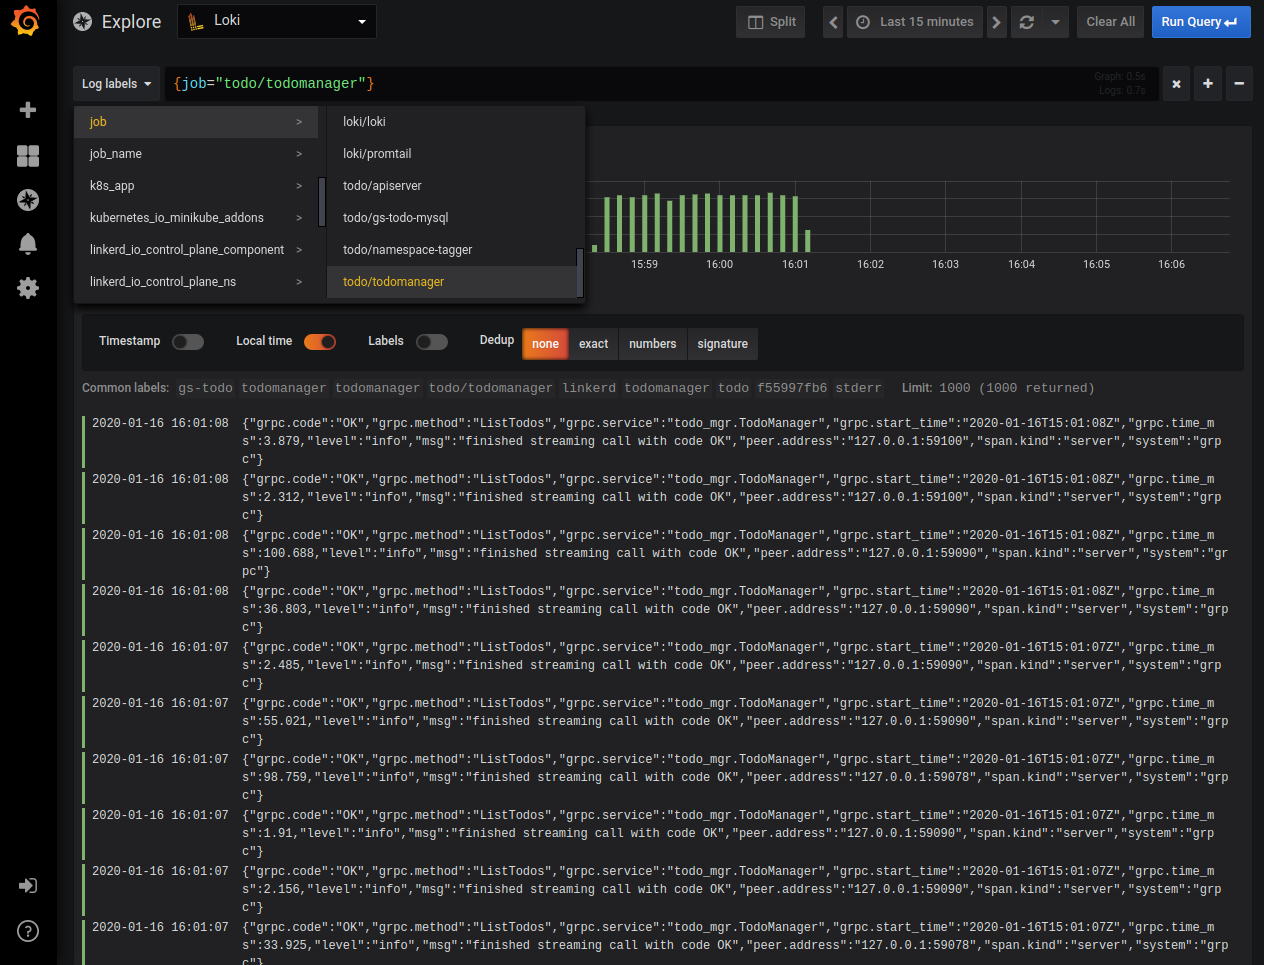
Like in the picture above, select a filter to show just the logs produced by “todomanager” service. We can see logs coming from all the “todomanager” pods and we can run text searches in them. Still, what Loki is expected to do is to let us apply different search criteria, indexes, and operators based on labels associated with log entries. This effectively allows us to use Loki’s query language LogQL to search our logs. But Loki doesn’t know how to turn our JSON formatted log entries into labels and the main log message. It's the application's responsibility to configure Loki to parse the application’s specific log format. Let’s do that now.
Configuring Loki
Our application provides structured JSON logs. Loki can turn this structure into a message with an associated set of labels, then build indexes on these labels, and allow us to use them for filtering. So, we have to tell Loki how to parse our log messages into labels. The configuration is pretty long and complex, so we’re providing a ready configuration file, but if you want to dig in, the reference documentation is available on Loki’s homepage.
Let’s apply the prepared configuration by fetching the current Loki’s configuration, appending changes specific to our application, then updating the config map and restarting the necessary pod:
$ kubectl -n loki get cm loki-promtail -o jsonpath="{..promtail\.yaml}" > promtail.yaml
$ cat ./config/promtail.yaml >> ./promtail.yaml
$ kubectl -n loki delete cm loki-promtail; kubectl -n loki create configmap loki-promtail --from-file promtail.yaml; kubectl -n loki delete po -l app=promtail
What does it change? Let’s see:
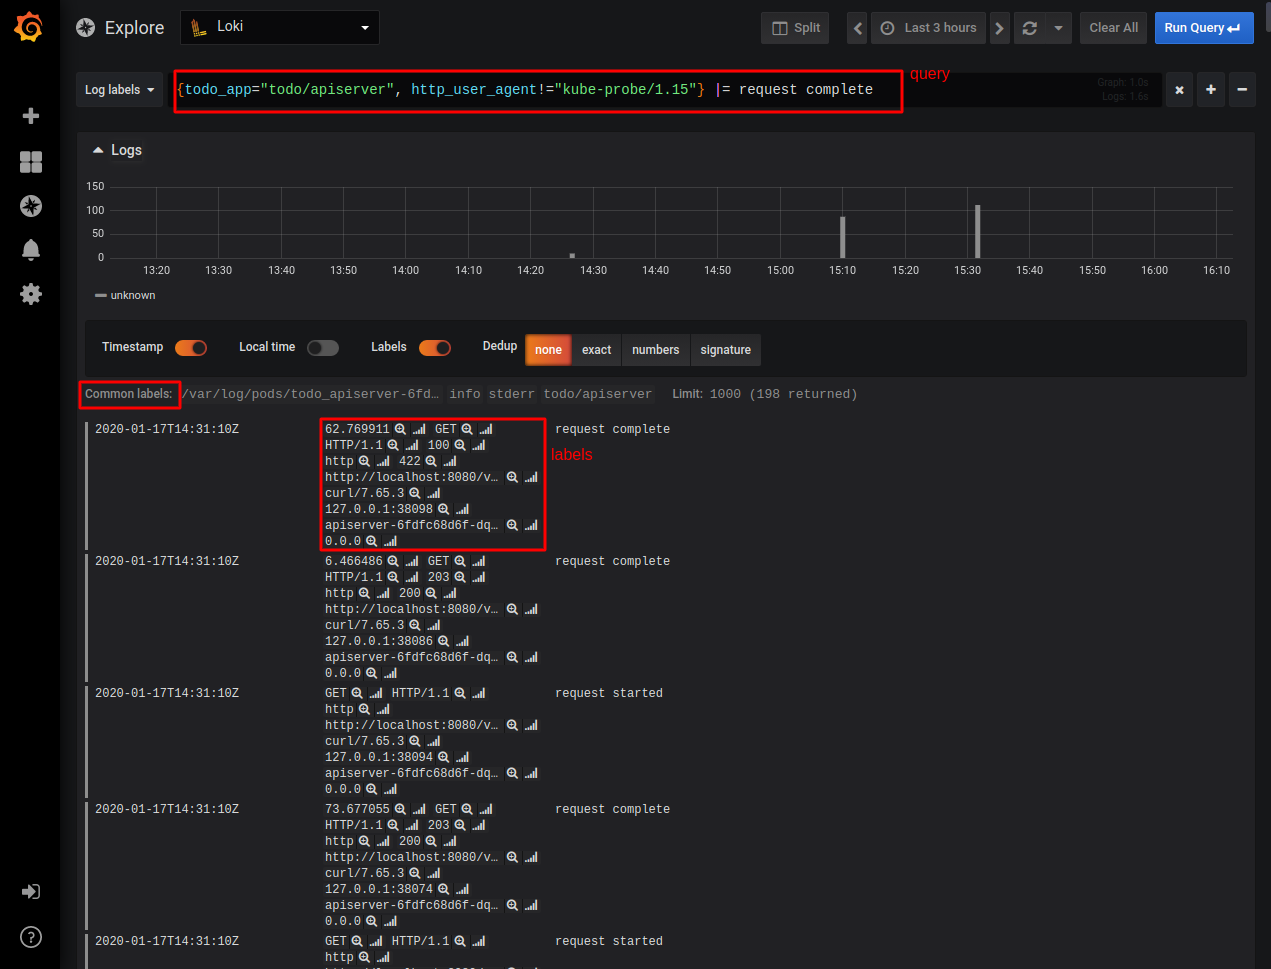
As you can see, now we can create a filter using a new label called “todo_app” that allows us to easily select different components of our application. In the query above we’re using this label to select logs coming from the “apiserver” only and being requested by an HTTP agent different than “kube-probe” (this is the readiness check agent that is polling the endpoint we defined for our apiserver Deployment).
Additionally, we’re looking for entries having the text “request complete” in the message part. In the log listing shown in the picture above, you can see the different labels values each of the log entries has. Labels that are present, but have the same value for all the selected entries are shown in the grey between the graph and the log listing. So, our log querying capabilities are now much better!
Using Grafana, we can combine our metrics and log data sources and investigate them in a single UI. This already makes our application much easier to observe and debug — and we got all of that without writing anything related to that functionality in our application!

Summary
Are we done with our project? Well, there are many things we can improve, but let’s stop here and try to sum up what we did so far.
We created a simple ToDo application in a microservice architecture. It consists of an API server that exposes REST interface, then consists of an actual service with business logic that is accessible through gRPC. That service in turn stores data in a MySQL database.
Then, we used some cloud-native tools to provide observability to our application. The important fact is that the application itself doesn’t really contain any instrumentation code that is responsible for interacting with that cloud-native stack.
Our observability is provided by two components: Loki and Linkerd. Loki is responsible for fetching logs from our containers, storing and indexing them, and of course, making them searchable. Linkerd fulfills even more tasks: we use it to get request metrics and service discovery, but also automatic mTLS encryption between all involved services. On top of both Loki and Linkerd, we use Grafana — a data presentation tool.
We also use many Kubernetes features to make our application available and robust. This includes:
-
- Deployments
To be able to easily scale and roll out new versions of our application.
-
- Readiness probes
To be sure that actual processes in the container work (and not just the container is started). We use anti-affinity hints to make sure that the Kubernetes scheduler will distribute our pods across instances and availability zones, limiting the impact of a single instance or zone failure.
-
- Network policies
To define our application firewall and explicitly list the allowed traffic.
-
- Pod disruption budgets
Which additionally guards our application during maintenance work in the cluster, preventing any management operations that would drive our pod count below a specific number.
-
- Pod security policy
Which limits our own pods in regard to extended privileges it can use, forcing us to provide more secure deployment.
-
- Helm
Which we used to pack everything into a single deployment package containing all elements of the application.
As you might have heard, there are three main sources of data in the observability area. So far we covered metrics and logs, but we’re missing tracing capabilities. That’s what the next part of the series will target!
In the meantime, if you have any comments or questions, let's connect: lukasz@giantswarm.io and @piontec on Twitter.
About Giant Swarm
When running Kubernetes clusters in production, you will realize that you will need more, sometimes much more, than just one cluster. You will need to care not only about the deployment but also upgrades, security issues, and monitoring. That’s where Giant Swarm can help — we offer managed Kubernetes clusters so that you don’t have to worry about managing them yourself. We also offer managed applications — well-known cloud-native projects that we can run for you on top of your Kubernetes cluster, creating a fully managed cloud-native platform.

Part 5: Traces of Your Microservices
Introduction Welcome to the fifth part of our blog series that focuses on how to develop, deploy, and debug microservices running in the cloud-native …

Grafana Logging using Loki
Loki is a Prometheus-inspired logging service for cloud native infrastructure.
Part 6: Prometheus — The Hidden Hero
Intro Let’s take a look back before we move forward. In our story so far, we’ve built our demo app (Part 1 and Part 2). Next up, in Part 3, we learned …