by Julien Garcia Gonzalez on Mar 22, 2019

Loki is a Prometheus-inspired logging service for cloud native infrastructure.
What is Loki?
Open sourced by Grafana Labs during KubeCon Seattle 2018, Loki is a logging backend optimized for users running Prometheus and Kubernetes with great logs search and visualization in Grafana 6.0.
Loki was built for efficiency alongside the following goals:
- Logs should be cheap. Nobody should be asked to log less.
- Easy to operate and scale.
- Metrics, logs (and traces later) need to work together.
Loki vs other logging solutions
As said, Loki is designed for efficiency to work well in the Kubernetes context in combination with Prometheus metrics.
The idea is to switch easily between metrics and logs based on Kubernetes labels you already use with Prometheus.
Unlike most logging solutions, Loki does not parse incoming logs or do full-text indexing.
Instead, it indexes and groups log streams using the same labels you’re already using with Prometheus. This makes it significantly more efficient to scale and operate.
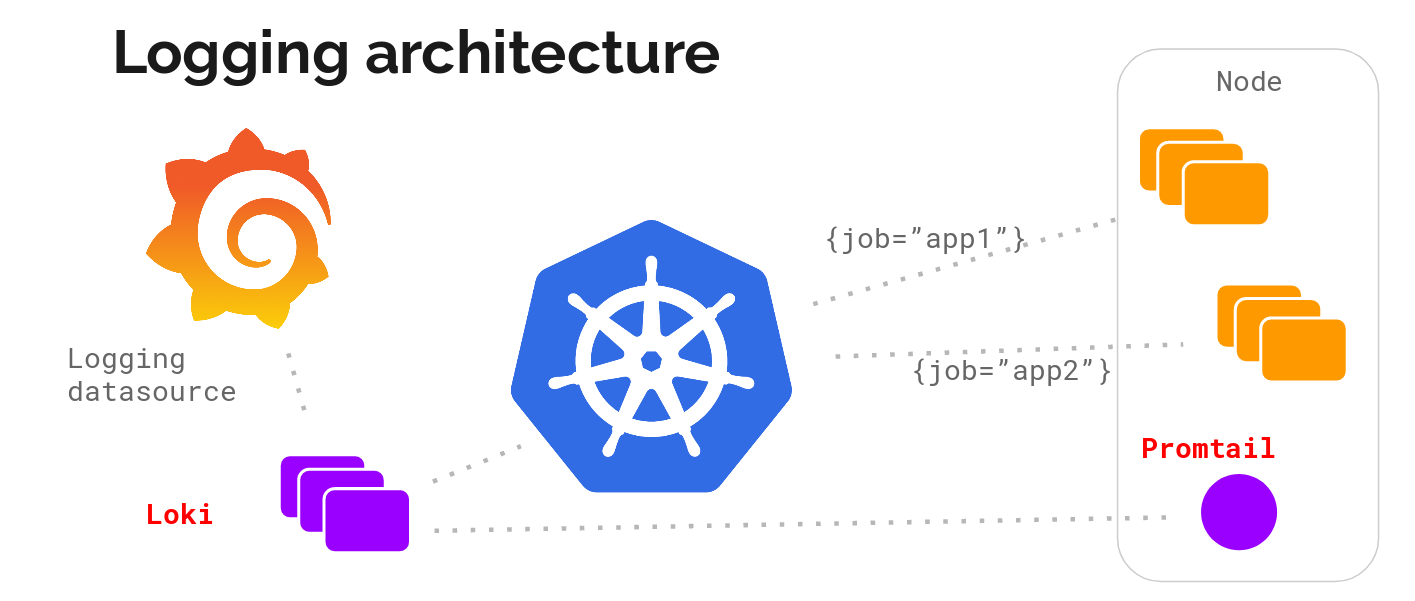
Loki components
Loki is a TSDB (Time-series database), it stores logs as split and gzipped chunks of data.
The logs are ingested via the API and an agent, called Promtail (Tailing logs in Prometheus format), will scrape Kubernetes logs and add label metadata before sending it to Loki.
This metadata addition is exactly the same as Prometheus, so you will end up with the exact same labels for your resources.
https://grafana.com/blog/2018/12/12/loki-prometheus-inspired-open-source-logging-for-cloud-natives/
How to deploy Loki on your Kubernetes cluster
1. Deploy Loki on your cluster
The easiest way to deploy Loki on your Kubernetes cluster is by using the Helm chart available in the official repository.
You can follow the setup guide from the official repo.
This will deploy Loki and Promtail.
2. Add Loki datasource in Grafana (built-in support for Loki is in 6.0 and newer releases)
- Log into your Grafana.
- Go to
Configuration>Data Sourcesvia the cog icon in the left sidebar. - Click the big
+ Add data sourcebutton. - Choose Loki from the list.
- The http URL field should be the address of your Loki server:
http://loki:3100
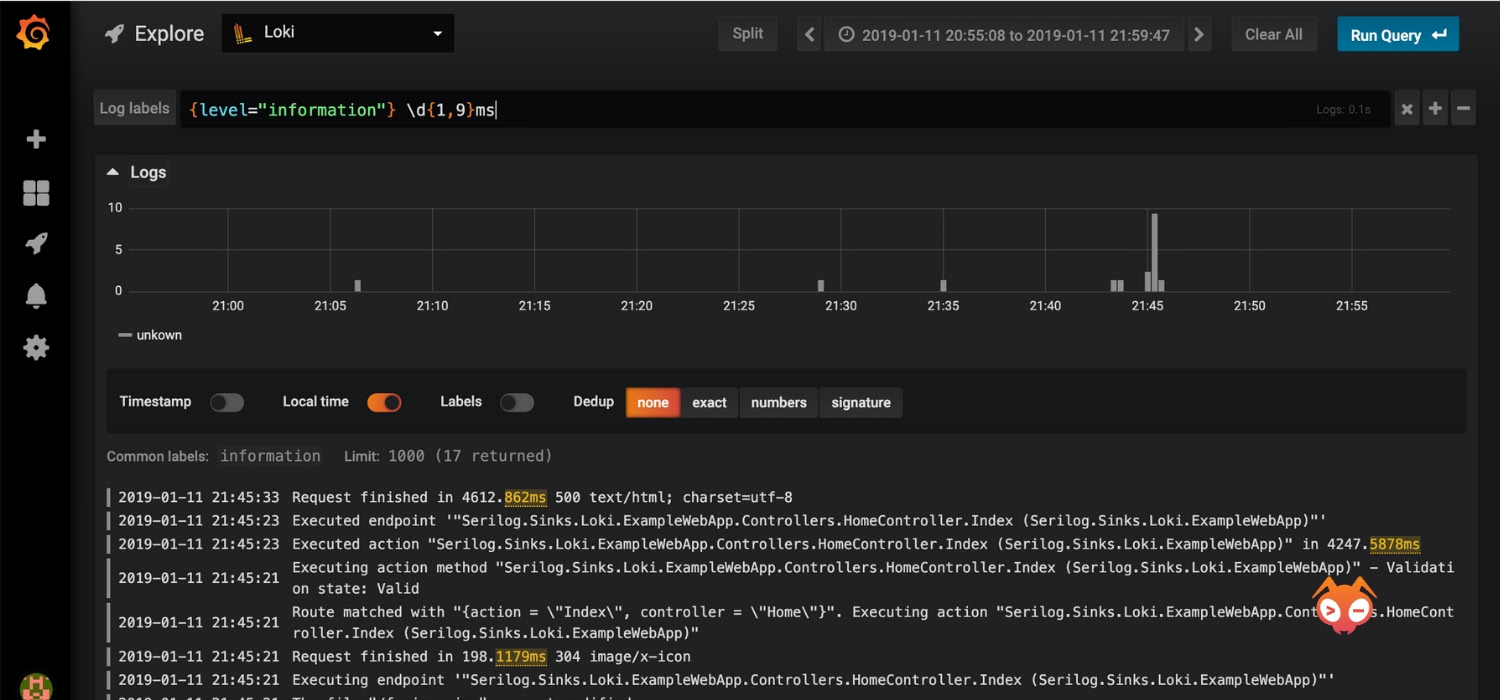
3. See your logs in the “Explore” view
- Select the “Explore” view on the sidebar.
- Select the Loki data source.
- Choose a log stream using the “Log labels” button.
Promtail configuration
Promtail is the metadata appender and log sending agent
The Promtail configuration you get from the Helm chart is already configured to get all the logs from your Kubernetes cluster and append labels on it as Prometheus does for metrics.
However, you can tune the configuration for your needs.
Here are two examples:
1. Get logs only for specific namespace
You can use the action: keep for your namespace and add a new relabel_configs for each scrape_config in promtail/configmap.yaml
For example, if you want to get logs only for the kube-system namespace:
    scrape_configs:
      - job_name: kubernetes-pods
        kubernetes_sd_configs:
        - role: pod
        relabel_configs:
        - source_labels: [__meta_kubernetes_namespace]
          action: keep
          regex: kube-system

    # [...]

      - job_name: kubernetes-pods-app
        kubernetes_sd_configs:
        - role: pod
        relabel_configs:
        - source_labels: [__meta_kubernetes_namespace]
          action: keep
          regex: kube-system
2. Exclude logs from specific namespace
For example, if you want to exclude logs from kube-system namespace:
You can use the action: drop for your namespace and add a new relabel_configs for each scrape_config in promtail/configmap.yaml
    scrape_configs:
      - job_name: kubernetes-pods
        kubernetes_sd_configs:
        - role: pod
        relabel_configs:
        - source_labels: [__meta_kubernetes_namespace]
          action: drop
          regex: kube-system

    # [...]

      - job_name: kubernetes-pods-app
        kubernetes_sd_configs:
        - role: pod
        relabel_configs:
        - source_labels: [__meta_kubernetes_namespace]
          action: drop
          regex: kube-system
For more info on the configuration, you can refer to the official Prometheus configuration documentation.
Use fluentd output plugin
Fluentd is a well-known and good log forwarder that is also a CNCF project. It has a lot of input plugins and good filtering built-in. So, if you want to for example, forward journald logs to Loki, it’s not possible via Promtail so you can use the fluentd syslog input plugin with the fluentd Loki output plugin to get those logs into Loki.
There’s an example, of how to forward API server audit logs to Loki with fluentd.
Here is the fluentd configuration:
  <match fluent.**>
    type null
  </match>
  <source>
    @type tail
    path /var/log/apiserver/audit.log
    pos_file /var/log/fluentd-audit.log.pos
    time_format %Y-%m-%dT%H:%M:%S.%NZ
    tag audit.*
    format json
    read_from_head true
  </source>
  <filter kubernetes.**>
    type kubernetes_metadata
  </filter>
  <match audit.**>
    @type loki
    url "#{ENV['LOKI_URL']}"
    username "#{ENV['LOKI_USERNAME']}"
    password "#{ENV['LOKI_PASSWORD']}"
    extra_labels {"env":"dev"}
    flush_interval 10s
    flush_at_shutdown true
    buffer_chunk_limit 1m
  </match>
Promtail as a sidecar
By default, Promtail is configured to automatically scrape logs from containers and send them to Loki. Those logs come from stdout.
But sometimes, you may like to be able to send logs from an external file to Loki.
In this case, you can set up Promtail as a sidecar, i.e. a second container in your pod, share the log file with it through a shared volume, and scrape the data to send it to Loki
Assuming you have an application simple-logger. The application logs into /home/slog/creator.log
Your kubernetes deployment will look like this :
1. Add Promtail as a sidecar
 apiVersion: apps/v1
 kind: Deployment
 metadata:
   name: my-app
 spec:
   template:
     metadata:
       name: my-app
     spec:
       containers:
       - name: simple-logger
         image: giantswarm/simple-logger:latest

 apiVersion: apps/v1
 kind: Deployment
 metadata:
   name: my-app
 spec:
   template:
     metadata:
       name: my-app
     spec:
       containers:
       - name: simple-logger
         image: giantswarm/simple-logger:latest
       - name: promtail
         image: grafana/promtail:master
         args:
           - "-config.file=/etc/promtail/promtail.yaml"
           - "-client.url=http://loki:3100/api/prom/push"
2. Use a shared data volume containing the log file
 apiVersion: apps/v1
 kind: Deployment
 metadata:
   name: my-app
 spec:
   template:
     metadata:
       name: my-app
     spec:
       containers:
       - name: simple-logger
         image: giantswarm/simple-logger:latest
         volumeMounts:
           - name: shared-data
             mountPath: /home/slog
       - name: promtail
         image: grafana/promtail:master
         args:
           - "-config.file=/etc/promtail/promtail.yaml"
           - "-client.url=http://loki:3100/api/prom/push"
         volumeMounts:
           - name: shared-data
             mountPath: /home/slog
       volumes:
         - name: shared-data
           emptyDir: {}
3. Configure Promtail to read your log file
As Promtail uses the same config as Prometheus, you can use the scrape_config type static_configs to read the file you want.
    scrape_configs:
      - job_name: system
        entry_parser: raw
        static_configs:
          - targets:
              - localhost
            labels:
              job: my-app
              my-label: awesome
              __path__: /home/slog/creator.log
And you’re done.
A running example can be found here
Conclusion
So Loki looks very promising. The footprint is very low. It integrates nicely with Grafana and Prometheus. Having the same labels as in Prometheus is very helpful to map incidents together and quickly find logs related to metrics. Another big point is the simple scalability, Loki is horizontally scalable by design.
As Loki is currently alpha software, install it and play with it. Then, join us on grafana.slack.com and add your feedback to make it better.
Interested in finding out how Giant Swarm handles the entire cloud native stack including Loki? Request your free trial of the Giant Swarm Infrastructure here.
Part 6: Prometheus — The Hidden Hero
Intro Let’s take a look back before we move forward. In our story so far, we’ve built our demo app (Part 1 and Part 2). Next up, in Part 3, we learned …

CVEing is Believing
This post is about abusing Prometheus in the name of security. At some point in their Kubernetes adoption, our customers inevitably find themselves ne …
Scaling on-demand Prometheus servers with sharding
It’s been a few years since we last wrote about our Prometheus setup. I’d recommend reading that article for context first, but for those looking for …