by Łukasz Piątkowski on Dec 21, 2020

In the six previous editions of this blog series, we learned how to build a cloud-native observability stack, and how to create and instrument a microservices-oriented application.
(Here’s your chance to catch up!)
Our journey is coming to an end, but before that, we still have one more stop. Let’s now use the tools we created to actually debug a problem.
TL;DR — watch
If you don’t have the time to dive into my entire series properly, I have good news for you! I recently hosted a webinar about open-source observability and I used this blog series as an example. As a result, we have a 20-minute recording of the debugging demo that I’m going to present here as well. Please note that there are some minor differences, but nothing really significant.
Short version
As usual, if you don’t want to go too deep, but still want to run our example on your own minikube cluster, here’s a set of instructions that will update your setup. Using this setup, you can already jump to the paragraph about investigating the problem.
git checkout blog_v4
# we changed some labels, so update is unfortunately not possible
helm delete --purge opencensus-collector
# install newer version of opencensus-collector
helm upgrade --install --namespace tracing  opencensus-collector -f ./helm/configs/opencensus-collector.yaml --version 0.1.4 giantswarm-playground/opencensus-collector-app

# use these commands later, instead of deploying from local code as shown in text
# for investigation of a non-instrumented application
helm upgrade --install gs-todo --namespace todo --timeout 90 --version 0.5.2 -f helm/configs/todo-no-tracing-and-failures.yaml giantswarm-playground/giantswarm-todo-app
# for investigation of an instrumented application
helm upgrade --install gs-todo --namespace todo --timeout 90 --version 0.5.2 -f helm/configs/todo-tracing-and-failures.yaml giantswarm-playground/giantswarm-todo-app
Long version
It’s time to put all of our work to good use. However, to do that, we need two things: some app updates and bugs in our app that we can trace!
Let’s start with checking out the code prepared for this entry:
git checkout blog_v4Updating our stack
We only need to upgrade one app, opencensus-collector. Unfortunately, the new release has a different set of labels from the version we used, so it’s impossible to do a Helm upgrade. We have to delete the release and deploy it from scratch:
helm delete --purge opencensus-collector
helm upgrade --install --namespace tracing  opencensus-collector -f ./helm/configs/opencensus-collector.yaml --version 0.1.4 giantswarm-playground/opencensus-collector-app
Code changes
This time, we’re not doing any big or important code changes. You can see the full diff on GitHub. Unfortunately, it involves a lot of CI/CD integration changes that you can safely ignore.
The notable code changes are that we've introduced:
- A configurable switch to disable tracing instrumentation (in both todomangager and apiserver).
- Some errors so we have something to debug:
- one is in apiserver
- and one is in todomanager.
Investigating problem
Our application is ready, and we can expect some problems with it. Please note, we’re going to investigate our application twice.
The first time, we will use our application with instrumentation turned off. This means that all we will have at our disposal are the application’s logs, metrics, and traces created automatically by our cloud-native observability stack. I think this is an important example as it shows what you can get from the observability stack without modifying the source code of your application. It’s kind of “observability for free” — we deploy tools, but we don’t have to change the code.
In the second approach, we’ll enable instrumentation in our application and check how it improves our observations.
Non-instrumented application
Let’s start with deploying the newest version of our application with instrumentation disabled:
helm upgrade --install gs-todo --namespace todo --timeout 90 -f helm/configs/todo-no-tracing-and-failures.yaml ./helm/giantswarm-todo-app
Now, let’s run curl the same way we did in previous parts of the series:

OK, as we can see from curl output, something’s not right — surprise! We can see that sometimes we get a failed response from our application. Additionally, if we take a closer look, it seems that some of the requests are successful, but it takes much longer to get a response.
To investigate, let’s first head to linkerd's dashboard:

What we can immediately see is that around 10% of all requests headed for apiserver fail. We want to check if this is only a transient problem or something that lasts a while. Let’s check the linkerd dashboard in grafana:

It seems that we have had this situation for a few minutes already. Additionally, one other thing looks really bad: the latency graph.
It shows that the 50th percentile of response time distribution is very low, in the range of single milliseconds (so, 50% of all requests are completed in less than a few milliseconds), but the 95th and 99th look terrible and go as high as a few seconds — 1000 times more! This means that the majority of our requests are processed very quickly, but we still have some requests that need a few seconds to complete. If we check the same graph for todomanager, we’ll see that the latency distribution is similar there, but 100% of the requests are successful. This gives us our first clues: it's most likely that apiserver is responsible for the failed requests and todomanager is responsible for creating some huge delays.
Next, let’s try logs. We’re going to run a few queries with loki:

Unfortunately, in this case, logs are cryptic: apiserver only logs information about HTTP requests that are being received and replied to, but nothing more.
If we switch to todomanager's logs, we won’t find anything useful either. Bad luck, logs aren’t going to help us this time.
Still, we have one more tool in our toolbox: tracing. Let’s check what we can find in jaeger:
 We can observe two interesting things here:
1. Traces of requests that took a really long time to execute (towards the top of the graph).
2. Some requests that are slightly (but visibly) longer than all of the other requests.
We can click the blue dots that represent them to learn more. Let’s start with the very long request on top:
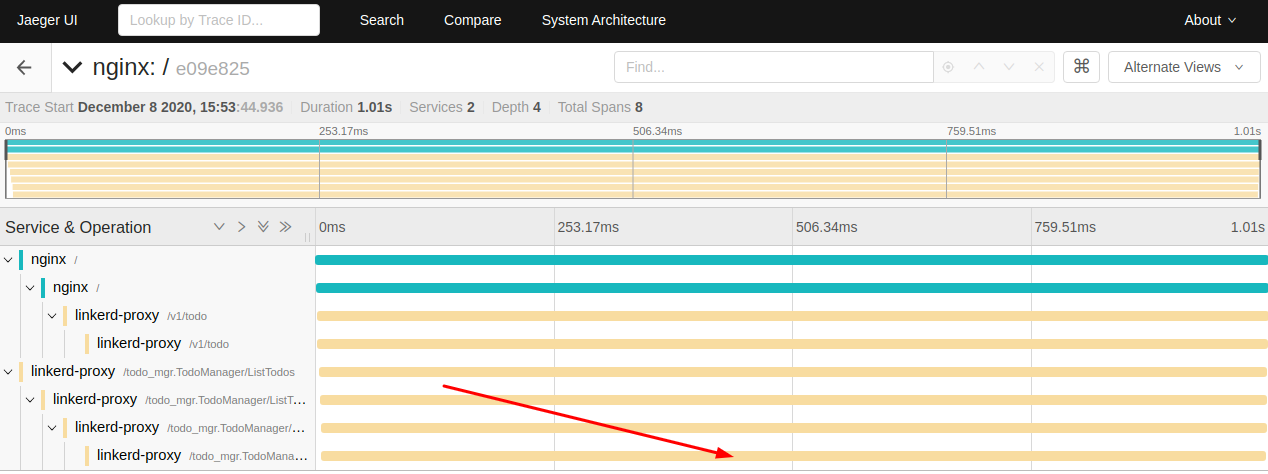
One thing definitely catches our attention: processing this request took almost the same time across all the services involved. This means that the source of the delay is at the very bottom of the call stack. In our case, the end service is todomanager — more proof that it is guilty of randomly introducing a very high delay.
Let’s also pay attention to one more thing: our trace is not “perfect”. Since we don’t have any tracing capabilities in our app (we disabled them), the only traces produced are coming from nginx and linkerd-proxy. Our trace actually represents two requests: the first one originates at HTTP client (our curl command), then passes through nginx, then goes to apiserver. From there, apiserver starts a separate call for gRPC service running in todomanager.
Since we’re not propagating the tracing context between them, they are also not stacked correctly in the tracing system.
OK, we still have that second type of request, the one that is only slightly higher than our faster requests:

In this case, you can see that the request is processed almost immediately by todomanager, but it’s the apiserver that introduces around 100 ms of delay.
To sum up, using our non-instrumented version of the application, we have learned that we have at least two problems:
1. apiserver sometimes fails with some requests, and sometimes passing on the request takes around 100 ms, while the majority of requests are forwarded in the single-digit milliseconds range;
2. todomanager usually needs a few milliseconds to respond, but sometimes it takes a few seconds.
It’s already helpful, especially when we can get it without changing the source code of our services. But let’s enable our instrumentation code in the application and see how that is different.
Instrumented application
It’s time to change our configuration and enable the instrumentation capabilities of our app:
helm upgrade --install gs-todo --namespace todo --timeout 90 -f helm/configs/todo-tracing-and-failures.yaml ./helm/giantswarm-todo-appIf you compare the linkerd data and logs that we receive, you’ll see no changes. However, that’s to be expected as linkerd already did what it could with our requests and we haven’t changed the logging code in any way.
However, the real difference is in tracing. Let’s have a look at the traces of two requests of types that have already caught our attention. Here’s the really long request:

Now we can immediately spot two differences: our two requests are now correctly combined into a single trace (that’s what we’re after) and it’s the db-list operation that takes so long in todomanager! We found our suspect: it’s not the todomanager itself, but the database that sometimes takes really long to return results. It seems we have to find our DBAs as soon as possible.
Let’s have a look at the second example:

This time we can clearly see that the delay is introduced by apiserver after it receives the HTTP request, but before it does the gRPC call to todomanager. So, the problem must be in the code handling incoming requests in apiserver. Another mystery (almost) solved!
Since we now have an instrumented version deployed, we can take a look at our custom grafana dashboard. However, it only confirms what we already know. Still, if our problem would occur for only a single user or a specific type of HTTP requests, or had some unusual distribution or variation in time, it also would provide us with valuable data.

Summary
Observability is a property of a system that allows us to conclude the internal status of the system using outputs that it produces. When we combine these outputs, like logs, metrics, and traces, with the correct tools, new possibilities appear. We can use the synergy effect of different observability sources and correlate them to understand the state of our system faster and more easily. That’s the whole point of observability: to be able to understand what’s going on when your pager rings or — even better — before it rings. Observability should decrease our response time and MTTR, and should make life easier for anyone doing on-call duties.
In this series, we went from zero to a complete example of an observable system. We started from scratch, wrote the code, then built our platform, and improved our code again. This has led us to the demo debugging session that we did today. I hope you enjoyed this journey and that you learned something, even if it took some time to get there.
Please let me know if you liked this series and hit me up with any suggestions or questions!
Part 5: Traces of Your Microservices
Introduction Welcome to the fifth part of our blog series that focuses on how to develop, deploy, and debug microservices running in the cloud-native …
Part 6: Prometheus — The Hidden Hero
Intro Let’s take a look back before we move forward. In our story so far, we’ve built our demo app (Part 1 and Part 2). Next up, in Part 3, we learned …

Part 3: Deploying the Application with Helm
An in-depth series on how to easily get centralized logging, better security, performance metrics, and authentication using a Kubernetes-based platfor …