by Thibaud Vaisseau on Oct 7, 2025
To support our customers wanting a simpler, UI-driven way to manage Grafana dashboards ("ClickOps"), we moved from a stateless, GitOps-managed setup to a persistent one. We implemented a PostgreSQL database using the cloudnative-pg
From GitOps to ClickOps: a new paradigm
As a platform engineering company, we at Giant Swarm have always championed GitOps. Our Grafana dashboards were only managed as code, versioned in a GitHub repository, and deployed seamlessly. This approach is perfect for engineers — it’s repeatable, transparent, and auditable. We never had to worry about persistence because the git repository was our single source of truth.
However, we serve a diverse range of customers. Some are platform users without a deep technical background. They don’t want to write YAML, submit pull requests, or clone Git repositories simply to save a dashboard. They expect a straightforward, intuitive user experience: create a dashboard in the Grafana UI, click "Save," and trust that it will be there tomorrow, regardless of pod restarts, cluster upgrades, or unexpected incidents.
This user feedback led us to embrace what we call "ClickOps" — a user-centric approach that prioritizes simplicity and allows users to manage resources through a graphical interface. To make this a reality for Grafana, we had to rethink our entire setup and introduce a critical new component: a persistent data store.
Our starting point: a stateless world
Before we embarked on this journey, our Grafana architecture was a model of simplicity. A standard Grafana deployment ran a single pod, which mounted dashboards from ConfigMaps in the cluster. These ConfigMaps are managed by a Helm chart, which is, in turn, driven by our GitOps repository.

This setup is lean and effective for our purposes, but it is fundamentally stateless. The Grafana instance itself held no unique data. All changes made from the UI were ephemeral, ready to be replaced or redeployed from Git at a moment's notice. To support ClickOps, we had to give Grafana a memory.
Designing a persistent architecture with cloudnative-pg
The investigation: finding the right tool
Our first step was to explore how to enable persistence in Grafana. The official documentation and community best practices quickly pointed to using a SQL database as a backend. This would allow Grafana to store all its data — dashboards, users, data sources, and configurations — in a central, durable location.
The next question was how to run a production-grade database on Kubernetes. Fortunately, team Shield at Giant Swarm was already using the cloudnative-pgcloudnative-pg
Implementation: building a resilient data layer
1. Database provisioning and automated backups
Our first task was to deploy a PostgreSQL cluster with a reliable backup strategy. With cloudnative-pg

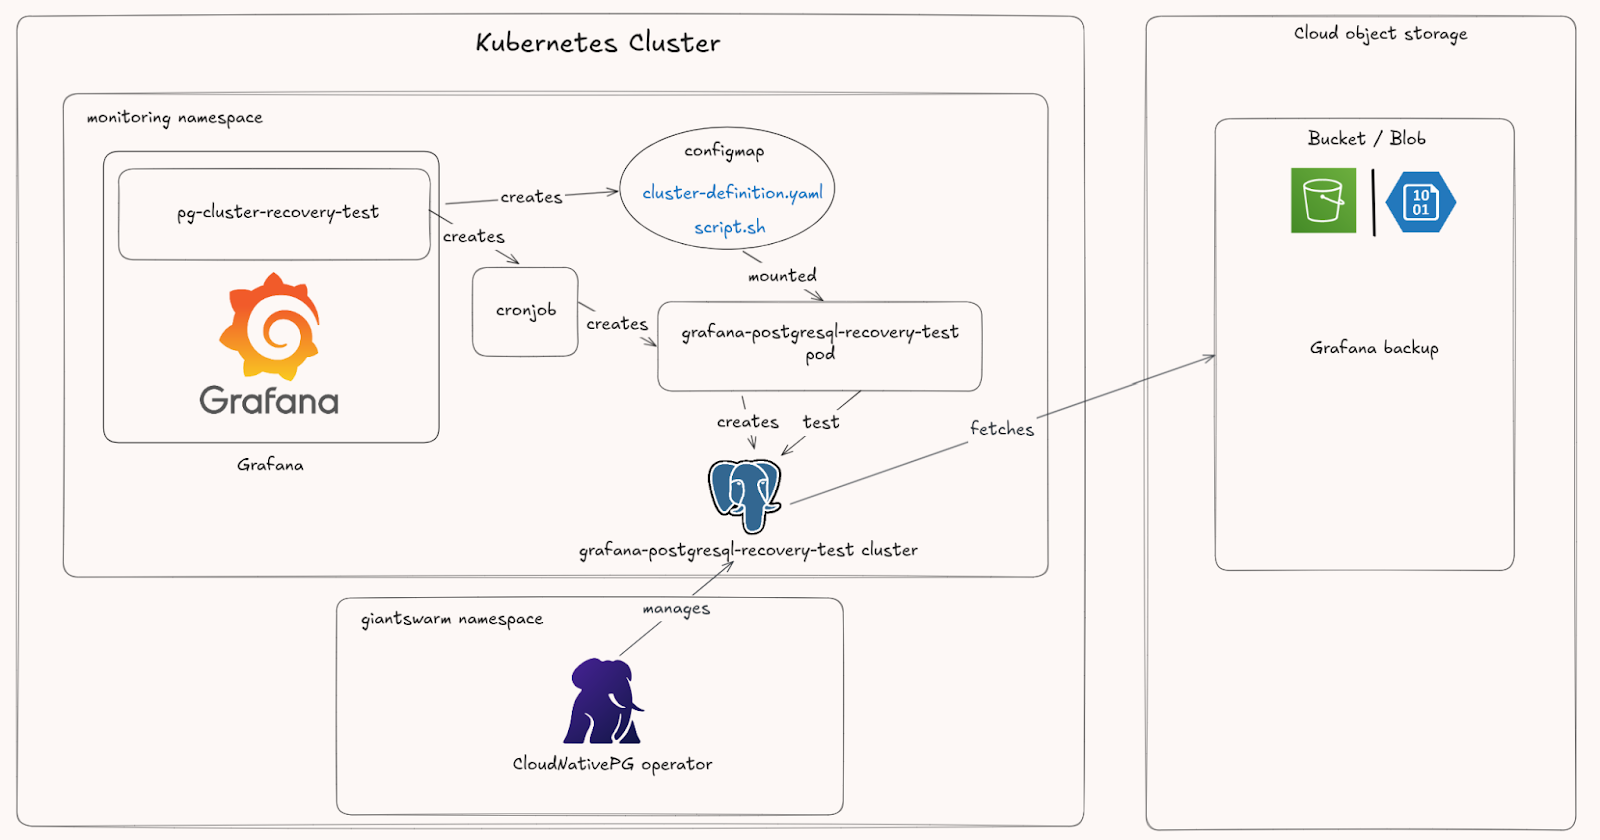
We defined a cluster.postgresql.cnpg.iografana-postgresql, lives in the monitoring namespace and is managed by the cloudnative-pggiantswarm namespace. The operator’s responsibilities extend beyond just running the database. It also handles backups by watching two other key custom resources:
Backups: Create an on-demand backup of a specified PostgreSQL cluster. The operator streams both the data and Write-Ahead Log (WAL) to a configured cloud object storage (like S3). This can be triggered manually by a user or automatically.
ScheduledBackups: Define a policy for creating Backup resources on a recurring schedule (e.g., nightly). This is the "set it and forget it" approach we prefer for ensuring data is always safe.
To streamline deployment, we added the Cluster and ScheduledBackup resources to the extraObjects field in our Grafana Helm chart’s values. This ensures the database is provisioned and configured alongside Grafana itself.
2. Disaster recovery and data restoration
With backups running, we needed a solid disaster recovery plan. What if the entire database cluster was accidentally deleted or corrupted? We had to be certain we could restore our data.
The recovery process with cloudnative-pg is designed for safety and simplicity. You don’t restore into an existing cluster. Instead, you create a new cluster.postgresql.cnpg.io cluster and configure its bootstrap section to initialize from a backup in object storage. The operator handles the rest, pulling the data and re-creating the cluster in a ready state. Once the new cluster is up and running, the old, broken one can be safely deleted. You can find more details on this in the official documentation.
3. Automated recovery testing
A backup strategy is only as good as its last successful restore. To ensure our disaster recovery plan was always viable, we needed to test it automatically and continuously.
We created a dedicated Helm chart that deploys two key resources for this purpose:
- A ConfigMap containing two files:
cluster-definition.yaml: A template for a testcluster.postgresql.cnpg.ioresource, configured to bootstrap from the latest backup of ourgrafana-postgresqlcluster.
script.sh: A test script that verifies the test cluster reaches a “Ready” state and its pods are running. If the tests pass, the script cleans up and deletes the test cluster. If they fail, the cluster is left running for inspection.
- A
CronJobthat mounts theConfigMapand executes the test script on a schedule. It creates a temporary PostgreSQL cluster from the latest backup, validates its health, and tears it down.
To complete the feedback loop, we added a Prometheus alerting rule that pages the on-call engineer if a test cluster recovery fails, meaning it requires investigation.
The challenges along the way
Of course, no project of this scale is without its hiccups. Here are some of the pitfalls we encountered, hoping you can avoid them.
A wrinkle in backup recovery
When creating a new PostgreSQL cluster that bootstraps from a backup, pay close attention to this new cluster backup destination path. If you enable backups on the new cluster, you must ensure its destinationPath in the object storage is a fresh, empty folder. cloudnative-pg’s backup and recovery tool, barman-cloud, cannot initialize a new backup history in a location that already contains backup data. This will cause the new cluster to fail its bootstrap process.
The perils of outdated operators
We initially hit a roadblock with an obscure bug in barman-cloud which caused arguments parsing errors. After some digging, we discovered a bug fix had been released and was integrated to a newer version of the operator. A simple upgrade to the latest cloudnative-pg version resolved the issue. Always ensure your operators are up-to-date!
Navigating cloud authentication
Our automated recovery tests failed because the test PostgreSQL cluster couldn't authenticate with AWS S3 to fetch the backup data. The cloudnative-pg operator creates a unique ServiceAccount for each cluster it manages. Even though we configured the test cluster with the same IRSA (IAM Roles for Service Accounts) annotation as our primary grafana-postgresql cluster, the underlying ServiceAccount name was different.
To fix this, we had to update the Trust Policy of the AWS IAM role to explicitly allow the ServiceAccount pattern (i.e., system:serviceaccount:<namespace>:<service-account-name>) used by our test clusters. This granted the temporary cluster the necessary permissions to access the S3 bucket.
Upstream contribution
More than once we hit a wall where the only solution was to fix the problem at its source. This led us to make several upstream contributions to cloudnative-pg, collaborating with the maintainers to develop enhancements that benefit the entire community. As a company built on open source, this is core to our philosophy. Contributing back is not just good karma; it makes the tools we rely on better for everyone.
The future is bright and persistent
Today, our Grafana service is stable, resilient, and meets the needs of all our users. Our customers can now embrace the ClickOps approach, focusing on their business-critical work without worrying about the underlying infrastructure. This allows for quick adoption of our observability platform with minimal overhead, especially for non-technical users who can immediately interact with Grafana’s intuitive UI to access data, manage dashboards, and more right out of the box.But the work of an engineer is never truly done. We already have plans for improvement:
- Enhance recovery tests: Go beyond checking if the cluster is ready. Do the restored dashboards actually load? Is the data accessible and uncorrupted? Does it match the original?
-
Stay current: A recent
cloudnative-pgrelease deprecatedbarman-cloud
Grafana-ception, or how we do Grafana analytics
1. Finding the right solution At Giant Swarm, we use Prometheus to monitor our infrastructure, but this is better explained in this blog post and in i …

Grafana Logging using Loki
Loki is a Prometheus-inspired logging service for cloud native infrastructure.
New: built-in Grafana dashboards now available to all Giant Swarm users
If you’re reading this, you probably already know how important observability is for cloud-native, especially at an infrastructure level. As part of o …