by Théo Brigitte on Sep 27, 2021
1. Finding the right solution
At Giant Swarm, we use Prometheus to monitor our infrastructure, but this is better explained in this blog post and in its follow-up.
On its own, Prometheus gives us a ton of metrics that are perfect for building an alerting system that gets people to react when things go wrong. However, getting a reaction isn't enough — people need to read and understand those metrics, and that's where Grafana, which serves as our operational dashboard, comes in.
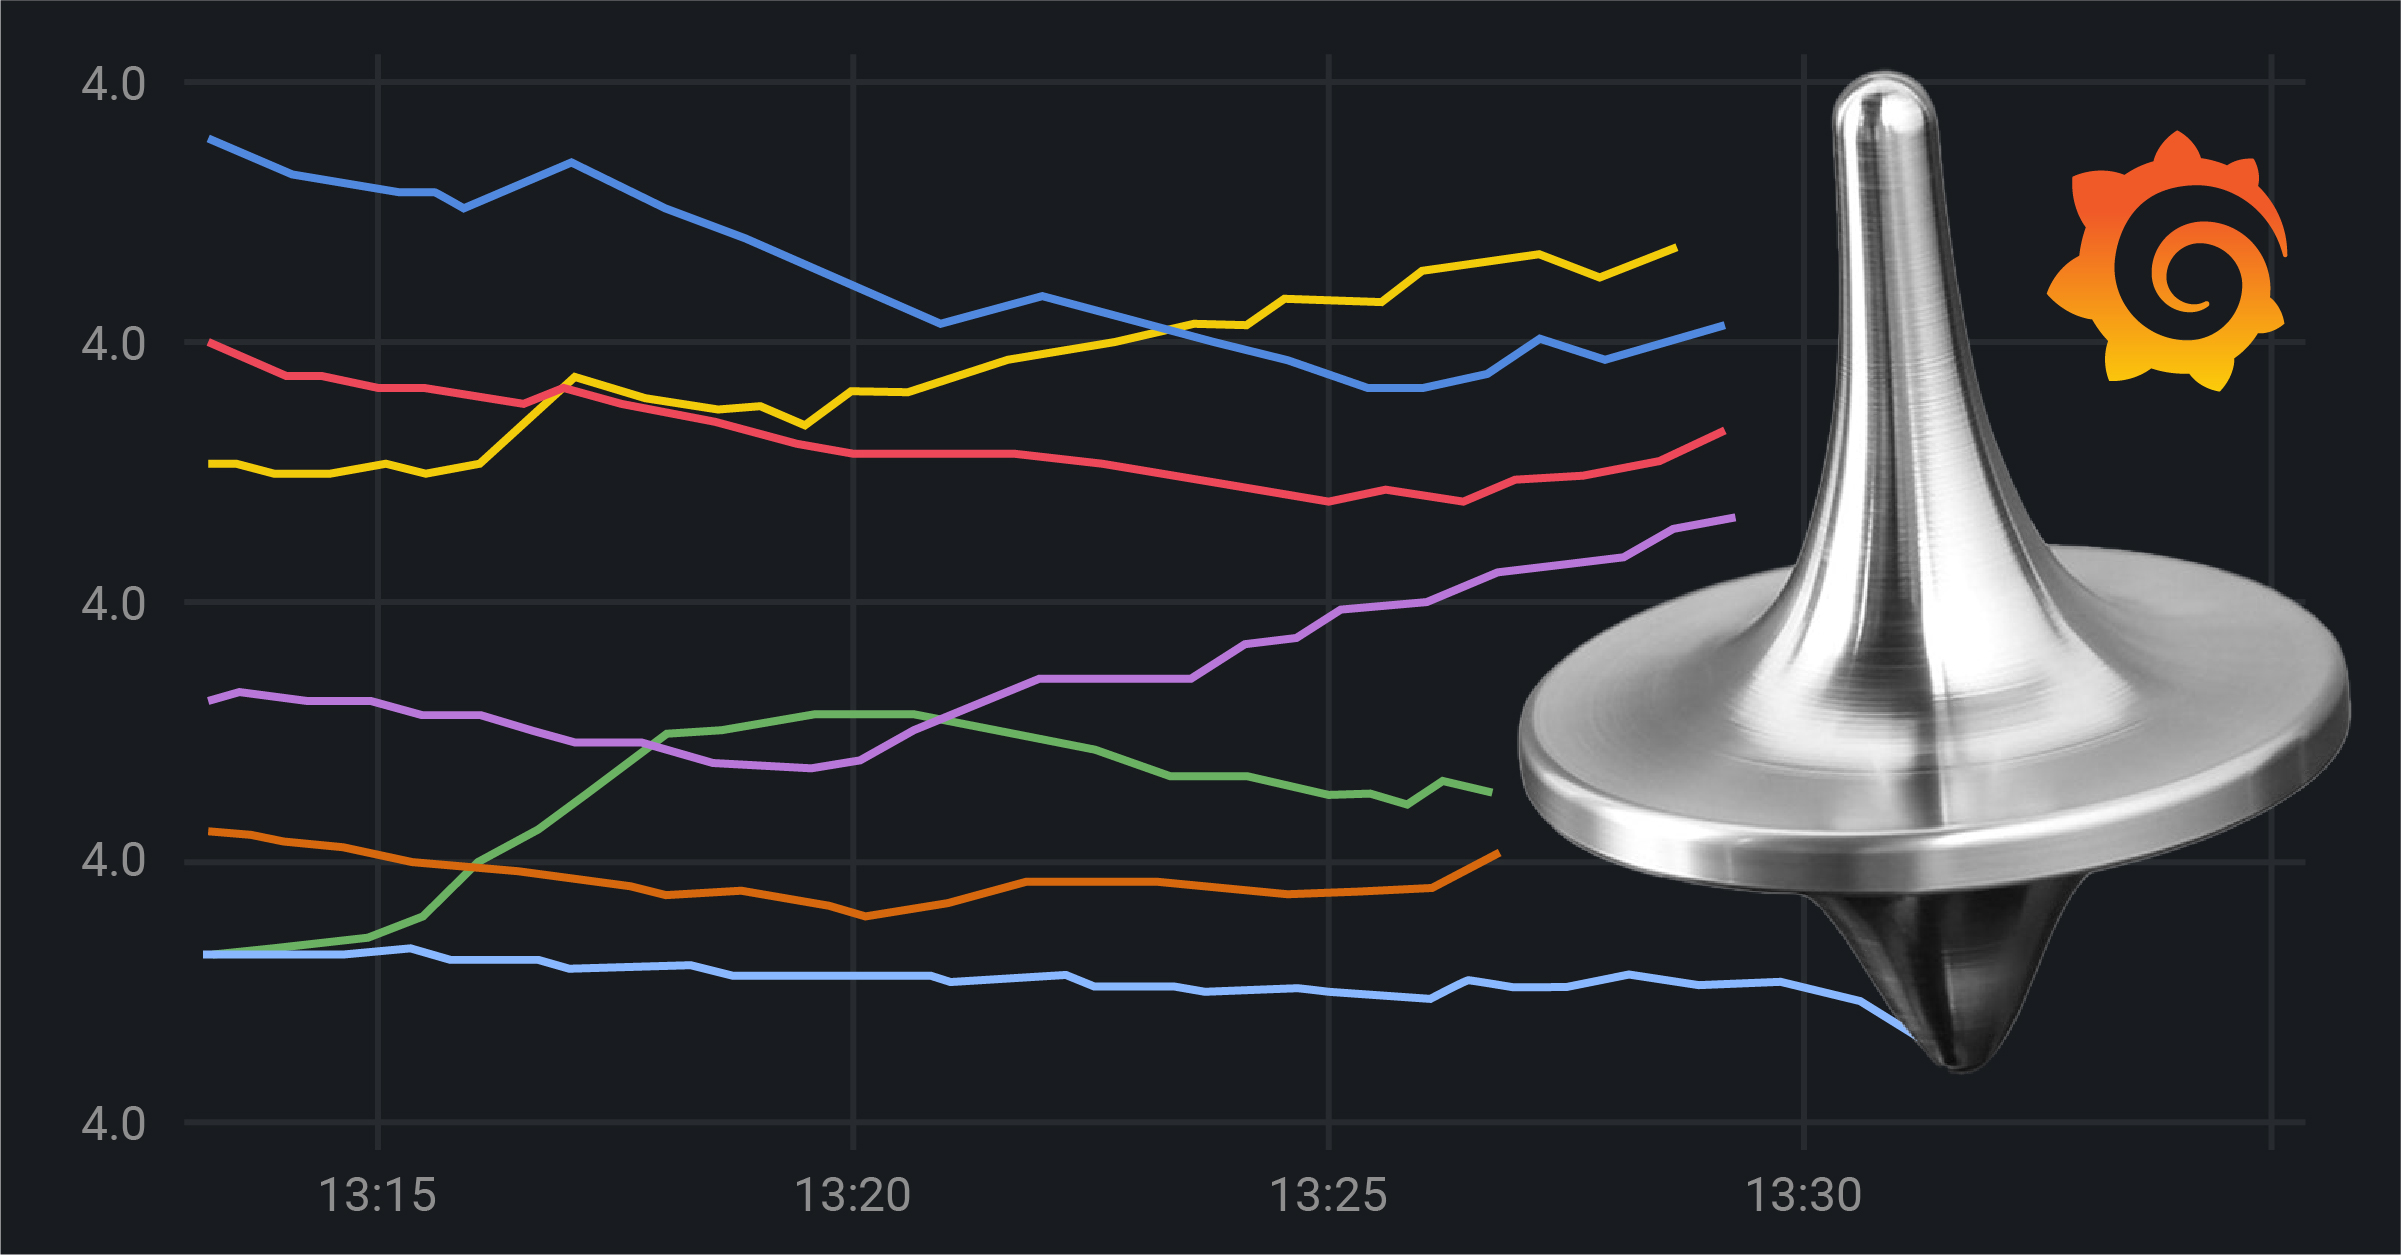
Because I think we can all agree, looking at this...

is so much better than this (which you’d have to gather across nodes and average and so on).
# HELP node_load1 1m load average.
# TYPE node_load1 gauge
node_load1 0.01
# HELP node_load15 15mn load average.
# TYPE node_load15 gauge
node_load15 0.27
# HELP node_load5 5m load average.
# TYPE node_load5 gauge
node_load5 0.2
Since both our customers and Giant Swarm team members can access those dashboards, we wanted to measure their utilization so we can better understand and answer questions like:
Which dashboards are useful?
What do people like best?
Are there any unused dashboards?
Our first idea was to just use Google Analytics because it comes bundled within Grafana and is straightforward to set up. But this only reports the first page load and would not report the next dashboard being visited, so we abandoned this option. And decided on a different solution.
The Analytics Panel plugin, which does what we need:
- Reports Grafana dashboards access, with:
- Timestamps
- Session duration
- Tab focused state
- Selected variables
- Username
- User roles
- Dashboard Name/ID
- Instance info
This is what we ultimately want to be looking at:

source: https://github.com/MacroPower/macropower-analytics-panel
Even better, it does so in the form of Prometheus data, so we can then visualize Grafana analytics in Grafana itself, yeah Grafana-ception! That's neat as we keep everything in the same place and avoid introducing a new tool.
2. Macropower Analytics Panel setup
From a high-level overview, here's what the setup will look like:
- macropower-analytics-panel plugin is installed in Grafana and sends analytics data to macropower-analytics-panel server.
- macropower-analytics-panel server stores analytics data from the plugin.
- Prometheus scrapes macropower-analytics-panel server.
- Grafana queries Prometheus and shows analytics data in a dashboard.
But a picture is worth more than a thousand words, so here you go:

We did follow upstream getting started.
2.1. Install the plugin
Basically, we added the following environment variable to our Grafana deployment.
GF_INSTALL_PLUGINS=macropower-analytics-panelNote: we're currently using 2.1.0 from a custom build, as we need the endpoint relative URLs.
2.2. Select, configure, and run a server
First, we packed the server into a Helm chart at giantswarm/macropower-analytics-panel-server-app and deployed it on our infrastructure (one instance for each instance of Grafana we host).
2.3. Configure the panel
We added, configured, and hid the macropower-analytics-panel to our dashboards.
{
      "datasource": null,
      "gridPos": {
        "h": 1,
        "w": 24,
        "x": 0,
        "y": 0
      },
      "id": 35,
      "options": {
        "analyticsOptions": {
          "dashboard": "$__dashboard",
          "flatten": false,
          "heartbeatAlways": false,
          "heartbeatInterval": 60,
          "postEnd": false,
          "postHeartbeat": false,
          "postStart": true,
          "server": "/analytics-plugin/write",
          "showDetails": false
        }
      },
      "title": "  ",
      "transparent": true,
      "type": "macropower-analytics-panel"
}
source: giantswarm/dashboards
On line 39, you will notice that we use relative URL for the server endpoint.
That is why it matters that it’s version >= 2.1.0, otherwise you’d need to specify the full URL here. And this allows us to use the same panel configuration to deploy to multiple instances of Grafana, each responsible for a separate installation, by making sure the analytics data is pushed to the instance of analytics-panel-server running on the same domain as Grafana.
3. The tweaks
To make it fully usable we (obviously) had to make some tweaks.
3.1. Data privacy / GDPR
The macropower-analytics-panel does expose metrics that look like this:
grafana_analytics_sessions_total{
  dashboard_name="Home",
  dashboard_timezone="utc",
  endpoint="web",
  grafana_env="production",
  grafana_host="grafana.******",
  user_locale="en-US",
  user_login="john@doe.com",
  user_name="John Doe",
  user_role="editor",
  user_theme="dark",
  user_timezone="browser"
} 1
There is some user-sensitive data in there like user_login and user_name that we do not want to collect, nor store anywhere in order to respect user’s privacy.
Here are the tweaks we did towards user privacy:
- Don't collect user-sensitive data by using
disable-user-metricsflag. - Drop
user_loginanduser_nameat scrape time from Prometheus viaServiceMonitorresource (ServiceMonitoris explained here and there), this is to be extra safe in case the previous flag somehow gets removed.
apiVersion: monitoring.coreos.com/v1
kind: ServiceMonitor
metadata:
  labels:
    app.kubernetes.io/name: macropower-analytics-panel-server
    app.kubernetes.io/version: 0.0.1
  name: macropower-analytics-panel-server
  namespace: monitoring
spec:
  endpoints:
  - metricsRelabelings:
    - action: labeldrop
      regex: (user_(email|name))
    port: web
  namespaceSelector:
    matchNames:
    - monitoring
  selector:
    matchLabels:
      app.kubernetes.io/name: macropower-analytics-panel-server
      app.kubernetes.io/version: 0.0.1
3.2. Authentication with Grafana auth mechanism
Once the macropower-analytics-panel server was up and running, we realized it was all open to the outside world and we'd rather have it protected by some auth mechanism instead because data security matters. Even though we could restrict access to the /write endpoint only, it still felt fishy that anyone could write data to our endpoint.
So here’s our solution, since the macropower-analytics-panel server is only accessed by the browser when logged into Grafana, we decided to protect the server by re-using the Grafana auth mechanism.
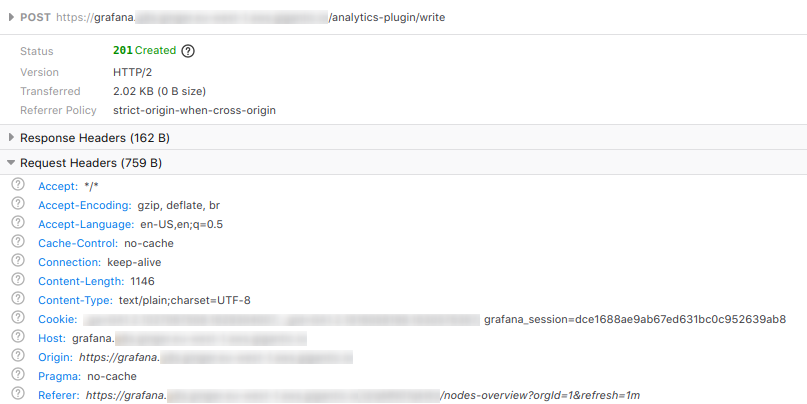
Grafana authenticates requests via a cookie which is sent for every request. By hosting the macropower-analytics-panel server under our Grafana domain, it allows this cookie to be carried over to our macropower-analytics-panel server. We then use nginx auth_request to authenticate the request back to Grafana.
Here you see the macropower-analytics-panel plugin request sent to the backend server being authenticated with grafana_session.
In order to achieve this we changed two resources:
- Added an annotation on the macropower-analytics-panel server ingress.
    nginx.ingress.kubernetes.io/auth-url: https://$host/grafana-auth
    nginx.ingress.kubernetes.io/rewrite-target: /write
This tells nginx to authenticate every request made to macropower-analytics-panel server via the /grafana-auth endpoint.
- Added an additional ingress for auth.
apiVersion: extensions/v1beta1
kind: Ingress
metadata:
  name: -auth
  namespace:
  annotations:
    kubernetes.io/ingress.class: nginx
    nginx.ingress.kubernetes.io/rewrite-target: /
spec:
  rules:
  - host:
    http:
      paths:
      - backend:
          serviceName: grafana
          servicePort: 3000
        path: /grafana-auth
This defines /grafana-auth endpoint to proxy to Grafana.
Quite a simple and lightweight solution.
Conclusion
Now that everything is set up, we can see how often each dashboard is visited.
In the future, this will help us focus on maintaining the dashboards that matter most. To my past self, I would say that the analytics journey to Grafana might be bumpier than expected. But on the way, we also learned how to reuse an existing authentication mechanism for a different backend service.
Thank you for reading up until here.
Credits to Jacob Colvin (@MacroPower) for his work on this plugin.

Grafana Logging using Loki
Loki is a Prometheus-inspired logging service for cloud native infrastructure.

Making Grafana remember: our journey to persistence with Grafana and PostgreSQL
To support our customers wanting a simpler, UI-driven way to manage Grafana dashboards ("ClickOps"), we moved from a stateless, GitOps-managed setup t …

New: built-in Grafana dashboards now available to all Giant Swarm users
If you’re reading this, you probably already know how important observability is for cloud-native, especially at an infrastructure level. As part of o …