
 by Thibaud Vaisseau on

Table of contents
Second part of our Envoy Gateway load testing series. Part one covered the test itself: the ephemeral clusters, the load generator, and how we got the metrics out. This one is about the last thing left over: who writes the report.
Every time we finished an Envoy Gateway performance test, the pipeline did its job and then quietly handed the work back to us. The clusters came up, the load generator hammered the two reverse proxies, the metrics landed in Mimir, and then nothing happened. Someone opened Grafana, took screenshots, built comparison tables in a document, wrote down what the numbers seemed to mean, and sent the result to the customer. Around an hour, every time, at the end of a test that otherwise ran itself.
That hour is the whole reason this post exists.
The last manual hour in a test that ran itself
An hour per test is not a dramatic number on its own. What it costs you is harder to see: a manual write-up at the end of a pipeline (reading the same six or seven dashboards in the same order, screenshotting the same panels, and assembling the same table: Envoy Gateway in one column, NGINX Ingress Controller or Kong in the other, latency, throughput, error rate…) is exactly the kind of friction that makes you batch tests up and put them off.
So we did what the pipeline was already doing everywhere else and automated it, this time with a claude-code agent.
What we expected the agent to hand back
So what does a finished run actually owe us? Three things:
- The data, queried rather than screenshotted. The agent asks Mimir for the series covering the test window, instead of us photographing panels.
- Graphs and comparison tables. The same shape we built by hand, so a reader sees at a glance how the two proxies held up.
- One file we can send. Self-contained HTML: open it locally, forward it to the customer who asked for the test.
Worth noticing what is absent from that list. The agent decides nothing. It does not gate a merge, pass a build, or touch the test itself. It reads metrics and writes a document. That narrowness looked like a limitation when we wrote it down. It turned out to be the most useful property of the whole design once we got to permissions.
Where should the agent run?
There were two realistic ways to do this.
- Claude Code GitHub Action: drop it in a workflow, let GitHub's runners host the agent, and let the Action handle the GitHub side of authentication for us. It is the obvious answer and it removes a large chunk of the plumbing described below.
- Run the agent ourselves, as a pod in the Tekton pipeline that already exists for the load test.
In the end we went with the pod, for the following reasons:
- The pipeline was already there. The load test runs as a Tekton pipeline on our own CI/CD cluster. Making the report a task in that pipeline meant the agent starts when the test finishes, with no second system to keep in sync.
- We wanted to own the container. The agent runs in a custom alpine image with claude-code installed, on a cluster we operate, in a namespace we scope. The agent is ephemeral, but it holds real credentials while it runs, and we would rather that happen somewhere we operate.
That’s a trade-off, not a verdict. We paid for it in exactly the way you would expect: everything the Action would have handled, we now had to build. That is the rest of this post.
One command, and the flow behind it
From the outside, the whole thing is one comment in a pull request:
/run envoy-performance-test
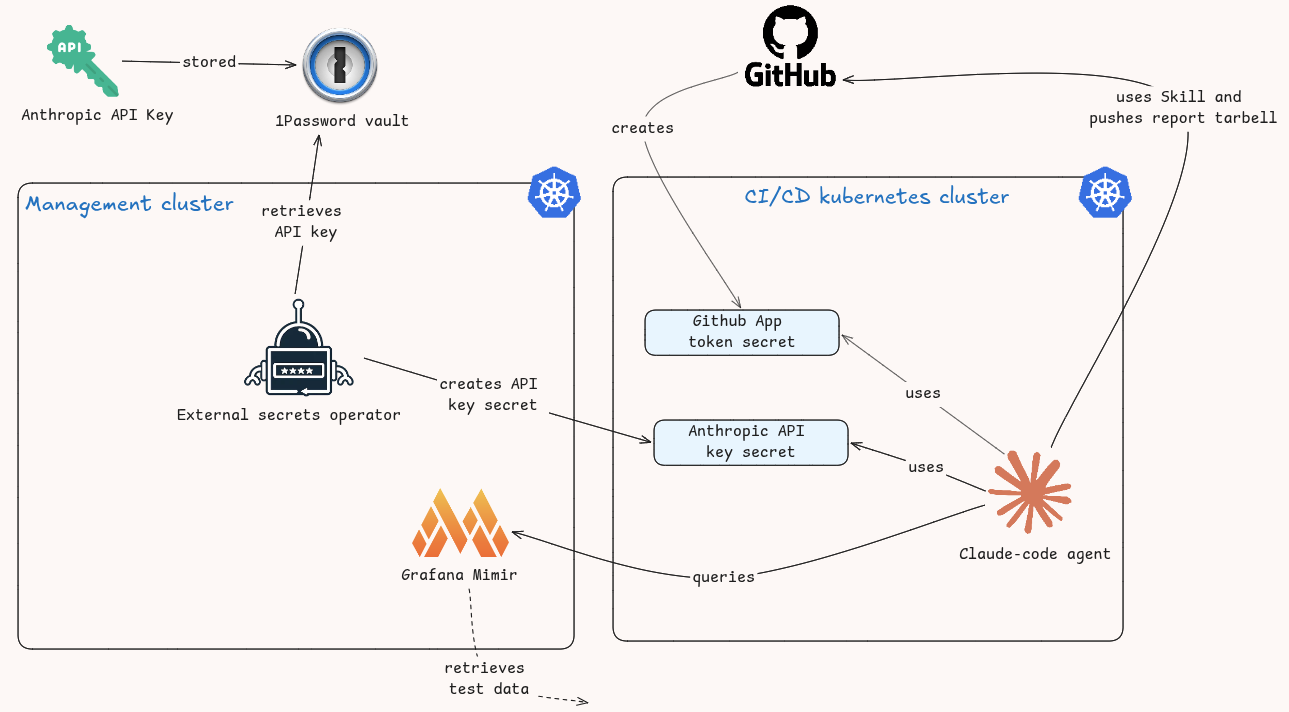
That comment triggers the Tekton pipeline on our CI/CD cluster. The pipeline creates the ephemeral workload cluster the load test runs on, installs everything the test needs, and runs it. When the test is over, it creates one more pod: the alpine image with claude-code in it.
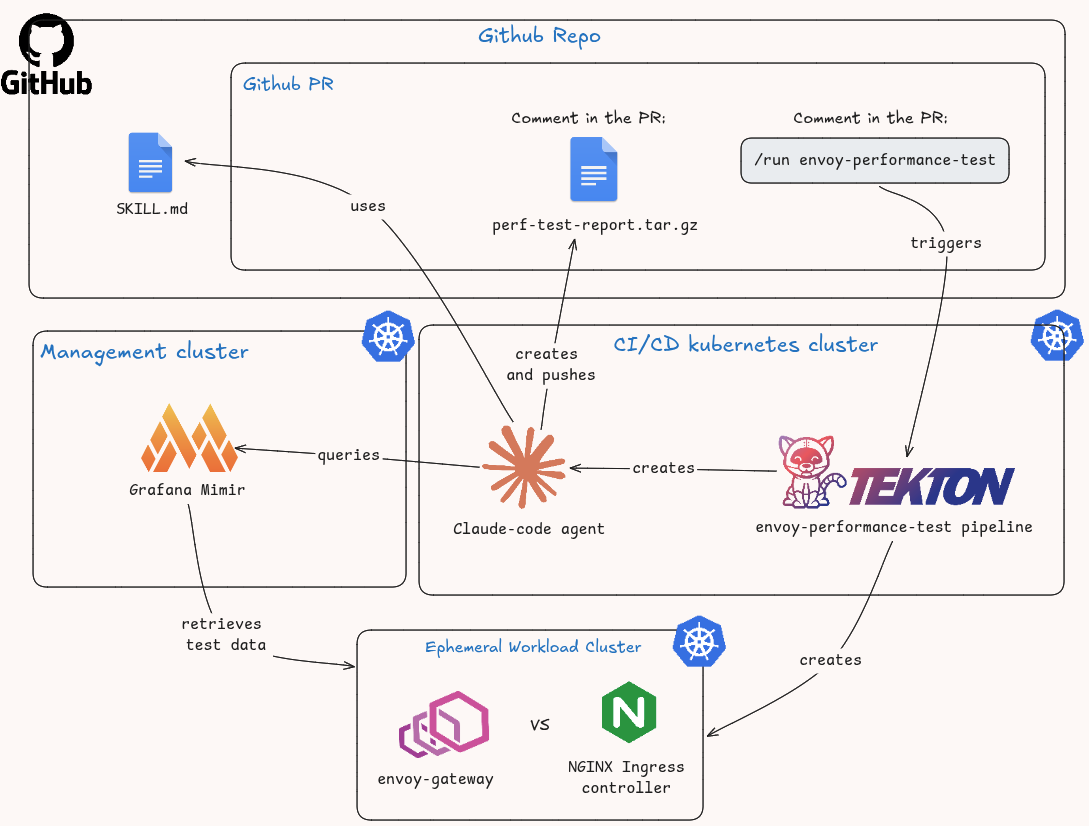
That pod launches the agent, which pulls the repository's own skill and follows it. The skill is where the report actually lives: it tells the agent which queries to run against Mimir, what to plot, and how to lay the HTML out. The agent queries the Mimir instance on the management cluster overseeing the test cluster, builds the graphs, writes its observations into the HTML file, tars it up, and posts it to the pull request as a comment.
The reader downloads the tarball, untars it and opens the file. That is the entire user-facing surface.
Which sounds finished, and it is not. Nothing in that description says how a pod on a CI/CD cluster is allowed to write to a GitHub pull request, or how an Anthropic API key gets into it without being committed anywhere. That is where the actual work was.
Permissions are where the work actually is
The agent was the easy part. Days went into credentials.
There are two entirely separate problems hiding behind the phrase "the agent needs permissions", and it helps to keep them apart:
- The GitHub side, which lets the agent read the skill from the repository, comment on the pull request, and push the tarball. This is negotiated between GitHub and our CI/CD cluster.
- The LLM API key side, which the agent needs to function at all. This is negotiated between our management cluster and the CI/CD cluster, and it is handled by the External Secrets Operator.
The GitHub side: a token that expires every hour
We start by creating a GitHub App in the organization and granting it the permissions the agent needs. The App gets a private key, and we store the PEM in a Kubernetes secret defined in our GitOps repository and SOPS encrypted, like every other secret we keep.
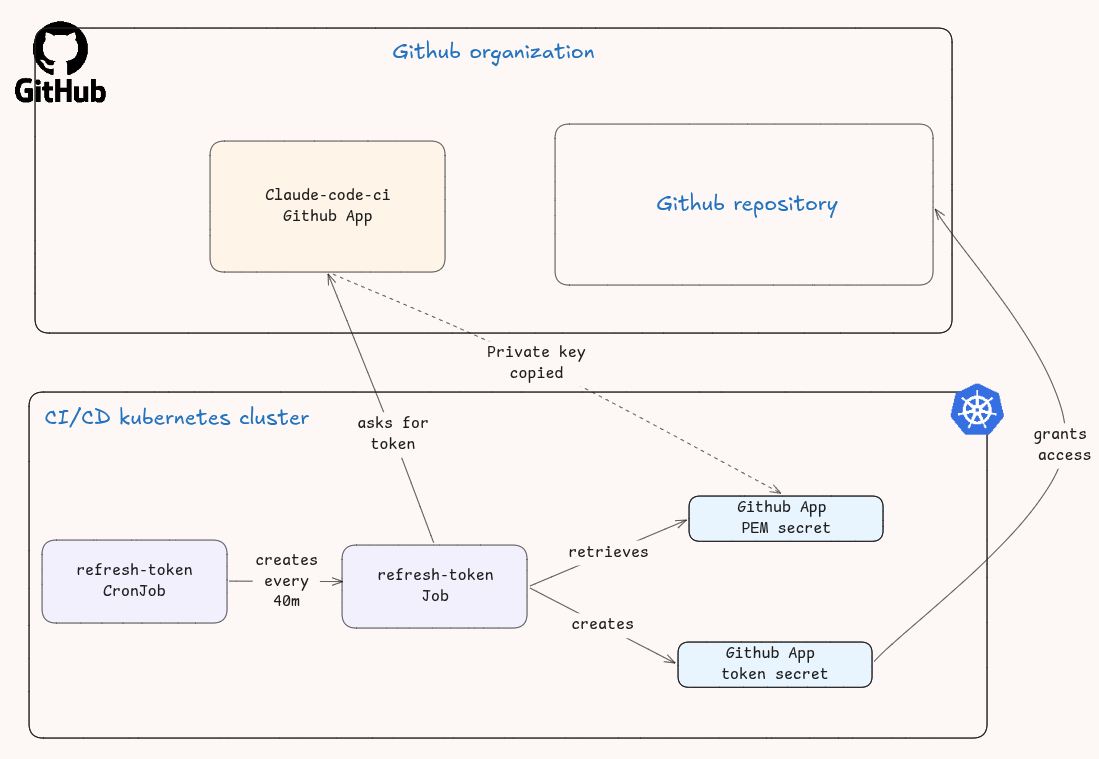
A PEM is not a token, though. GitHub App installation tokens are valid for one hour, which means something has to keep minting them.
That something is the least glamorous actor in this whole setup: a refresh-token CronJob that fires every 40 minutes. Each Job it creates does four things: load the PEM from the secret, build and sign a JWT with it, exchange that JWT for an installation access token at api.github.com/app/installations/<app_installation_id>/access_tokens, and write the token into a secret of its own.
Forty minutes for a sixty-minute token is deliberate. It leaves a margin, and it means the token is always already there.
That last point is why this is a CronJob rather than a step in the pipeline. Minting the token in-pipeline would tie the credential's lifetime to a pipeline run, and the token has to be valid and current regardless of whether anything is running. So it rotates on its own schedule, and the agent pod simply mounts the resulting secret and reads it from the environment as GITHUB_TOKEN.
The GitHub half is genuinely straightforward. The other half is not.
The API key side: why we picked the complicated option
The Anthropic API key lives in a vault in our own 1Password. Getting it from there into a pod on a different cluster has a much simpler answer than the one we chose, so it is worth saying why we did not take it.
The simple option is to SOPS encrypt the API key directly, commit it to the GitOps repository next to everything else, and let it land on the CI/CD cluster as a secret. One resource, no operator, done.
The criterion that decided against it was rotation. With a SOPS encrypted secret, rotating the key means rotating it in 1Password and re-encrypting and committing and waiting for reconciliation, in every place the key exists. We wanted rotation to be one action: roll the key in 1Password and let everything downstream follow.
So we built the longer chain instead.
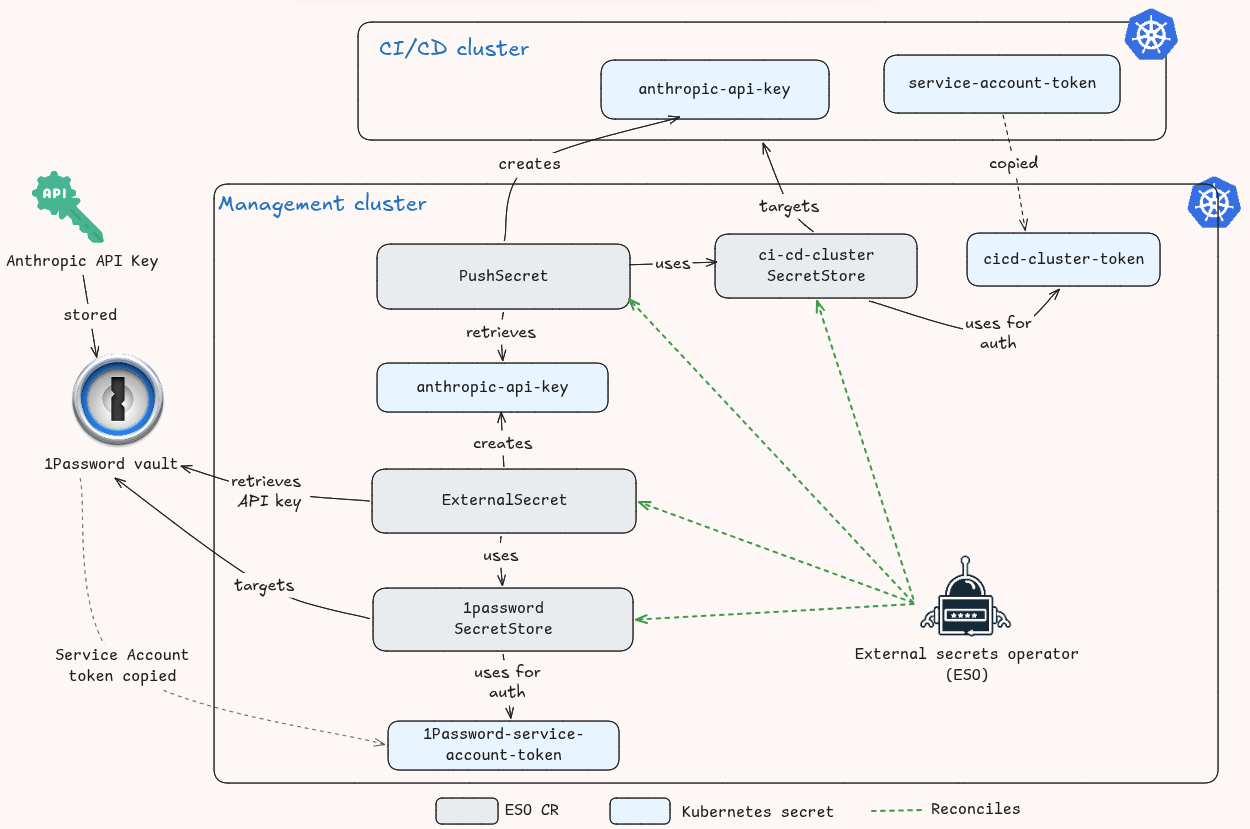
It needs two secrets to bootstrap it. The first is a 1Password service account token, stored as a secret on the management cluster. It’s SOPS encrypted in the GitOps repository, same as the PEM. It grants access to the vault holding the API key and is very unlikely to rotate as it’s bound to a 1Password vault whose only purpose is to store information.
The second handles the other direction: how does the management cluster get permission to write into the CI/CD cluster? We create a Kubernetes service account in the namespace where the agent pod will run, bind it to a Role that can create secrets in that namespace, generate a kubernetes.io/service-account-token secret for it, and copy that token into a secret on the management cluster. Whatever loads it can write into that one namespace on the CI/CD cluster, and nowhere else.
On top of those two, four External Secrets Operator (ESO) resources that hand the key along:
- 1Password SecretStore: targets the vault, authenticating with the service account token.
- CI/CD cluster SecretStore: targets the CI/CD cluster, authenticating with the copied service account token.
- ExternalSecret: fetches the API key from the vault through the first SecretStore and materializes it as a secret on the management cluster.
- PushSecret: reads that secret and creates a new one in the agent's namespace on the CI/CD cluster, through the second SecretStore.
The PushSecret is the only resource in the chain that reaches across the cluster boundary, and it is the one worth understanding if you build this: everything before it is ordinary secret fetching, and everything after it is a pod mounting a secret.
Which it now does. The agent pod loads the API key, loads GITHUB_TOKEN, and runs its prompt.
What the agent is actually allowed to do
Everything above is about how the agent gets credentials. The question that matters more is what it can do while holding them.
Here is the honest answer. The GitHub App is granted read and write, at organization level, on: Contents, Commit statuses, Checks and Pull Requests.
Write on Contents is what lets the agent push the tarball. Pull Requests is the comment. Commit statuses and Checks are how the pipeline reports back.
The permission set is only half the blast radius question, though. The other half is the trigger. /run envoy-performance-test is a comment in a pull request, and a pull request is text a human wrote, which is the class of problem OWASP files under prompt injection. Thankfully, Tekton pipelines are only triggered with a specific command and the prompt given to the claude-code agent is hard-coded in the pipeline definition in our GitOps repository.
What limits our exposure in practice is how narrow the agent's job is: query Mimir, build graphs, write one HTML file. It has no reason to go near the diff. That is worth holding on to if you adapt this pattern for something that does read the diff, because the credentials sitting in that pod are the same either way.
An hour a test, and what comes next
The result is what we set out for: one comment in a pull request, and the full comparison between Envoy Gateway and either NGINX Ingress Controller or Kong runs, analyzes itself, and comes back as a downloadable report with graphs and tables in it.
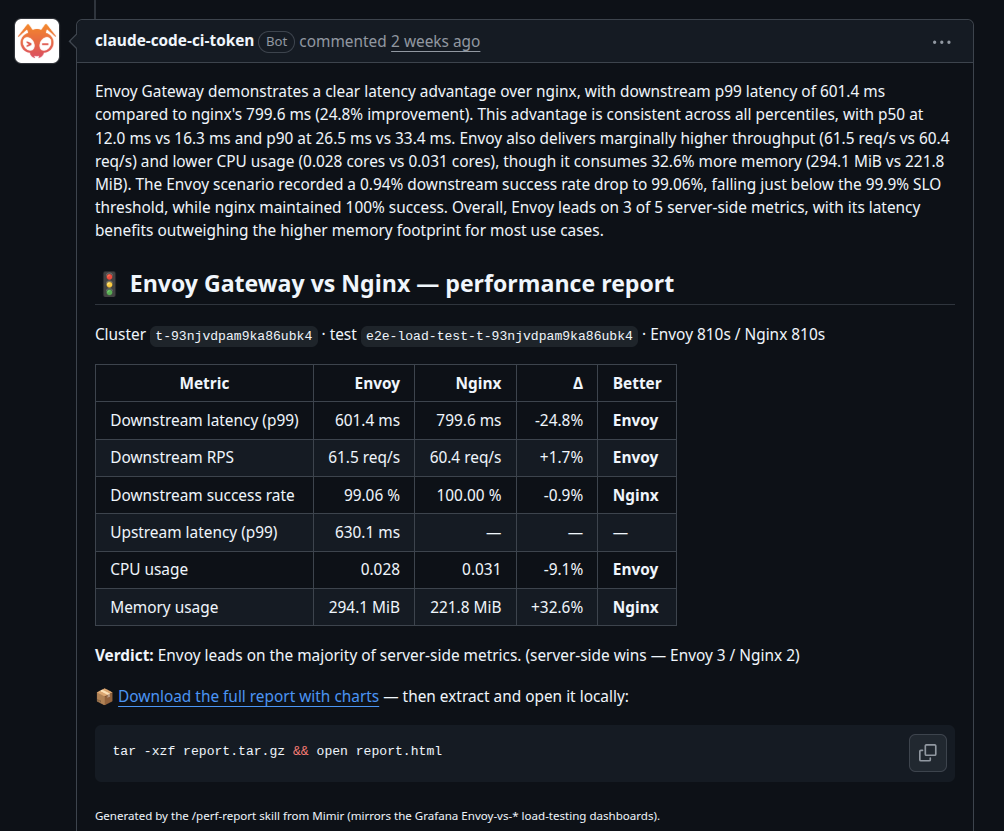
And when opened, the HTML file looks as follows (sample screenshots):
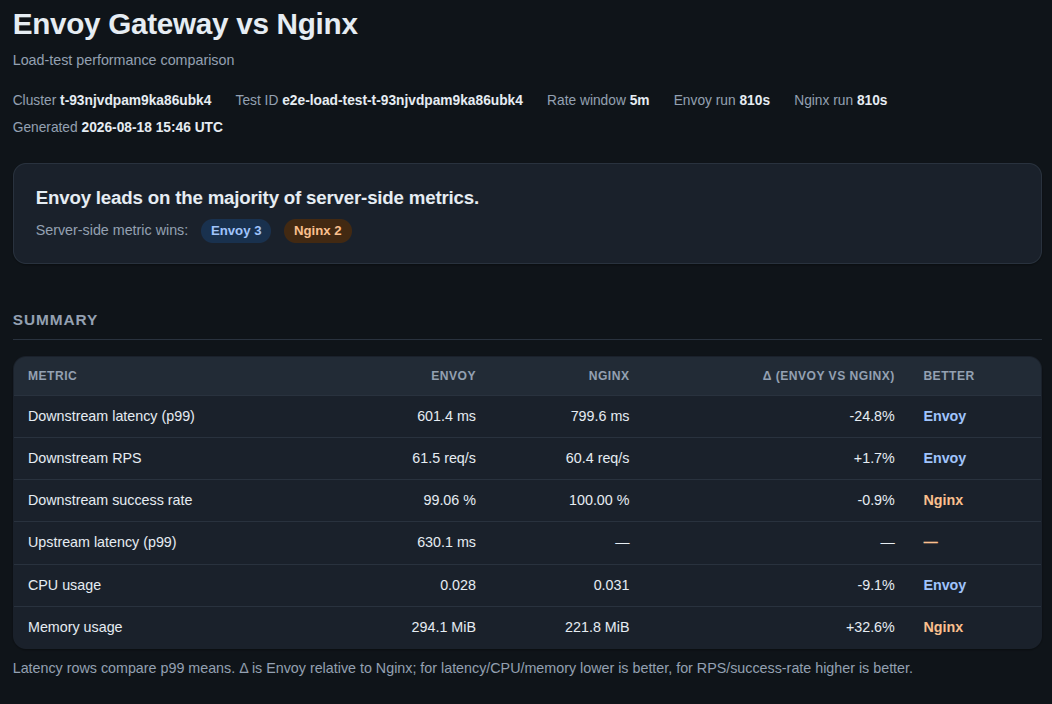
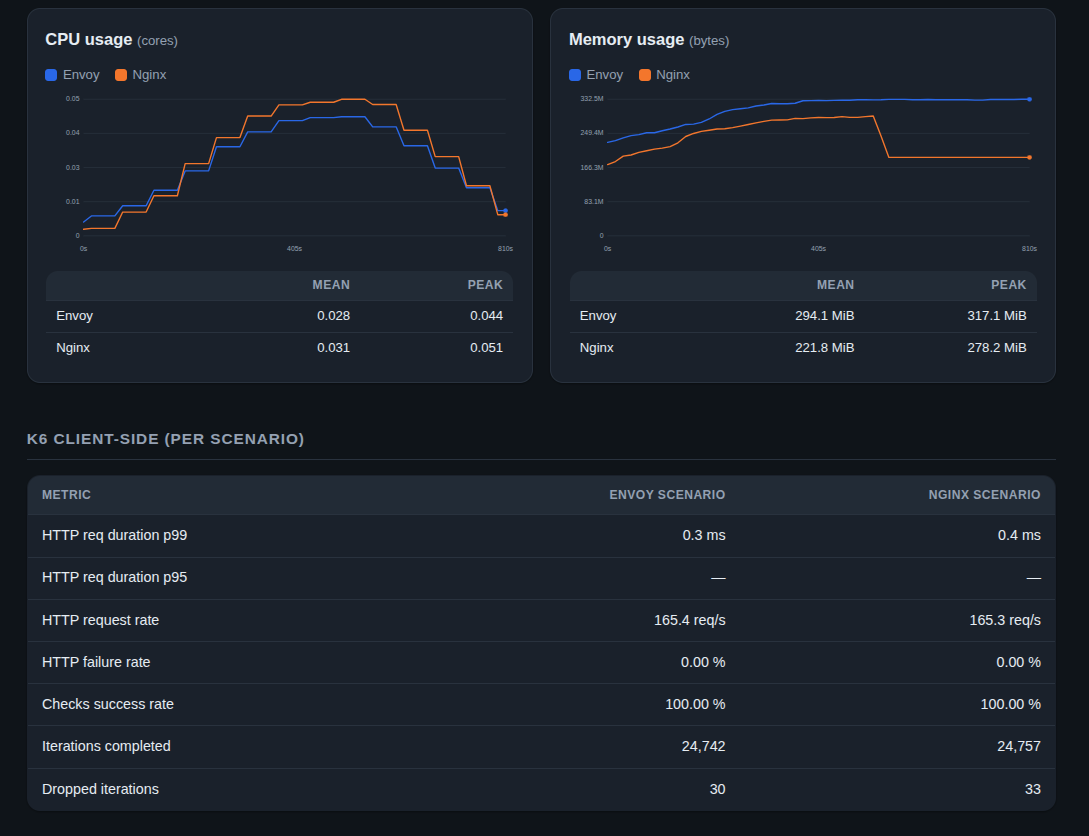
We are not finished with it. The next thing we want from the skill is a proper abstract at the top of the report, not only the graphs and the tables, but a holistic read of what differs between the two proxies, where that difference might come from, and where the test itself might be biased. Interpretation is still the part a human does, and it is the part worth automating next.
If there is one thing to take from this, it is the shape of the work rather than the architecture. Getting claude-code to write a good report was the easy half. Getting a GitHub App token and an API key into an ephemeral pod, safely and rotatably, in a way we could still explain to ourselves six months later, was where the days went. Even if your use case has nothing to do with load testing, that half will look much the same.
Until next time!
so this is right?