

 by Thibaud Vaisseau on

Table of contents
Some migrations you plan. Others get scheduled for you.
On November 11th, 2025, the Kubernetes SIG Network and the Security Response Committee announced the retirement of the Ingress NGINX project, effective March 2026. That date is now behind us. For everyone who was still running ingress-nginx in production, and that was a lot of us, moving to Gateway API ("the next generation of Kubernetes Ingress, Load Balancing, and Service Mesh APIs") was the only way forward. We just didn't know yet what it would cost us.
Not knowing is uncomfortable when you operate ingress on behalf of other people. We have SLOs on request latency. We have customers whose peak traffic we absorb without negotiating about it. Replacing the component that every single one of those requests passes through is not something you want to do on the assumption that it will probably be fine. So we measured it.
This is the first half of a two-part series. This post is about the measurement: the disposable cluster every run builds for itself, the load generator and the metrics pipeline behind it, the scenario we settled on, and what the numbers said about Envoy Gateway next to Ingress NGINX at 5000 requests per second. The second part is about the one thing the rig still handed back to us at the end of every run, the report, and how a Claude Code agent running as a task in the same pipeline now writes it instead.
Why Envoy Gateway, and why performance had nothing to do with it
So which one will it be? Which Gateway API implementation should we go with? You already know which one we picked, but there were several open-source competitors to choose from: Traefik, Kong, HAProxy… In the end, we chose Envoy Gateway for the following reasons:
- It is already quite stable and widely adopted by the community.
- It is a CNCF project, which matters to us since we’re part of CNCF ourselves.
- The documentation looked more extensive and more complete than what the alternatives offered.
Notice what is not on that list: performance. We cared about it, we just had nothing to compare it against yet. Maturity you can assess by reading release notes and issue trackers. Documentation quality you can assess in an afternoon. How a proxy behaves at 5000 requests per second with a realistic request mix is something you can only find out by sending it 5000 requests per second.
Which is what the rest of this post is about: the rig we built to do that, and what it told us.
A cluster we could throw away
Our production setups are complex, and complexity is exactly the kind of thing that contaminates a benchmark. Testing against one of them would have meant spending most of our time explaining away the environment instead of reading the results.
So we did the opposite: every load test run creates its own dedicated Kubernetes cluster, and deletes it the moment the test completes. Nothing survives except the metrics.
The interesting part is not the ephemeral cluster itself; it's that we automated the whole thing. A combination of scripts and kustomizations builds the environment, and the entire sequence runs as a Tekton pipeline triggered from our Envoy Gateway GitHub repository. In practice this means we edit one config file to set every parameter of the test (cluster size, node count, load test client tuning), then trigger a run from the repo.
For the results below, that config produced a 15-node cluster: 3 control plane nodes and 12 workers, each with 16 vCPU and 64 GiB of memory. Worth keeping in mind for later, because at peak the test only consumed 27% of the cluster's total CPU. Whatever the numbers show, the cluster was never the limiting factor.
A disposable cluster is only worth having if you can see inside it before it disappears, though.
Getting the data out before the cluster disappears
The metrics pipeline is the part of the setup that decides whether a test run produces data or just heat. Since we already run a complete observability platform, it was only natural to rely on it here rather than build something bespoke.
A Grafana Alloy instance runs on the generated cluster, scrapes everything we need, and pushes it to one of our Mimir installations. Because Mimir lives outside the ephemeral cluster, the data outlives the cluster that produced it, and the Grafana dashboards we read the results from sit alongside Mimir rather than on the throwaway environment.
For traffic generation we went with Grafana k6. There is no shortage of tools that can generate load, but one of our customers was already using k6, and we’re well integrated in the Grafana ecosystem, since we run a full LGTM stack for observability. k6 runs as an operator reconciling TestRun CRs, which define which scenario to run and how. The operator then generates runner pods that carry out the requests.
In order to have a complete overview of the load test, we needed data on how the test client itself handled the requests it sent: exactly how many requests it sent, the success rate, the nature of the requests… As the runner pods generated by the operator don't natively expose metrics, we configured them to push their metrics directly to the same Mimir receiving the data from the Alloy instance in the testing cluster.
That detail matters more than it looks. Knowing what the client thinks happened, and separately what the proxy thinks happened, is what later let us explain the one number that did not make sense.
A backend and a scenario, both deliberately unrealistic
Even if the main character in the test scenario is Envoy Gateway, it remains a reverse proxy and as such, it needs to redirect the incoming requests sent by the load generator to a backend. Considering this, two paths were possible:
- Deploy some of our or our customers' applications to the ephemeral cluster and wire those to Envoy Gateway.
- Deploy a simple demo application whose only goal would be to receive and sustain the load sent by Envoy Gateway.
The first option would have spared us the hassle of familiarizing ourselves with a new app, but our apps are usually quite complex and resource-hungry, and the focus of the test isn't the backend. We went with the second option and picked Google's microservices-demo, tuned a bit: packaged for easy Helm deployment, HPA added so it could actually sustain the traffic it was about to receive, and support added for Envoy Gateway, Kong and NGINX resources. On top of that sit the cert-manager CRs handling TLS, a ClusterIssuer and one Certificate per public endpoint.
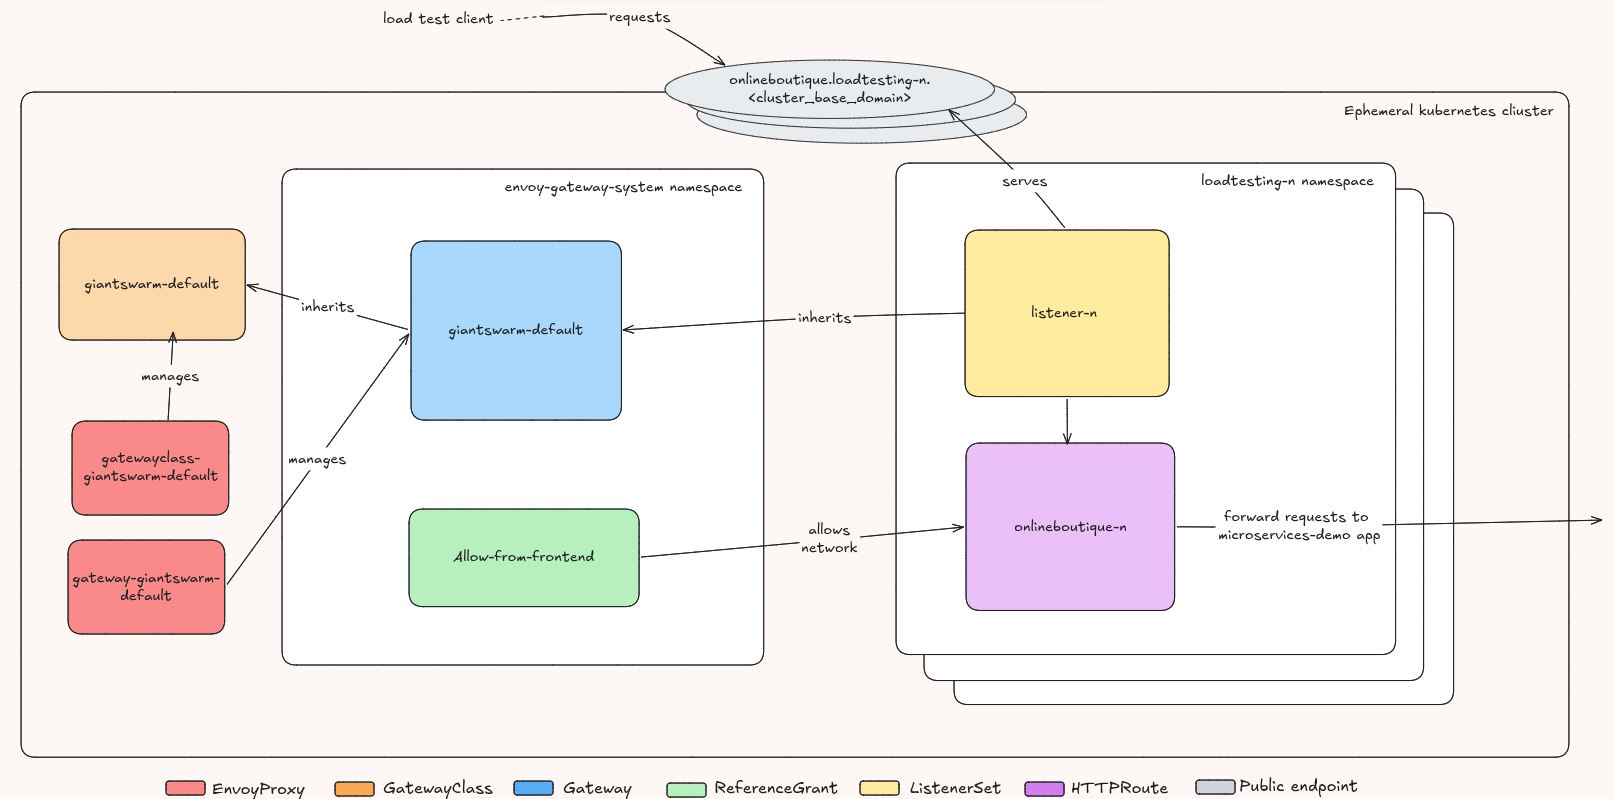
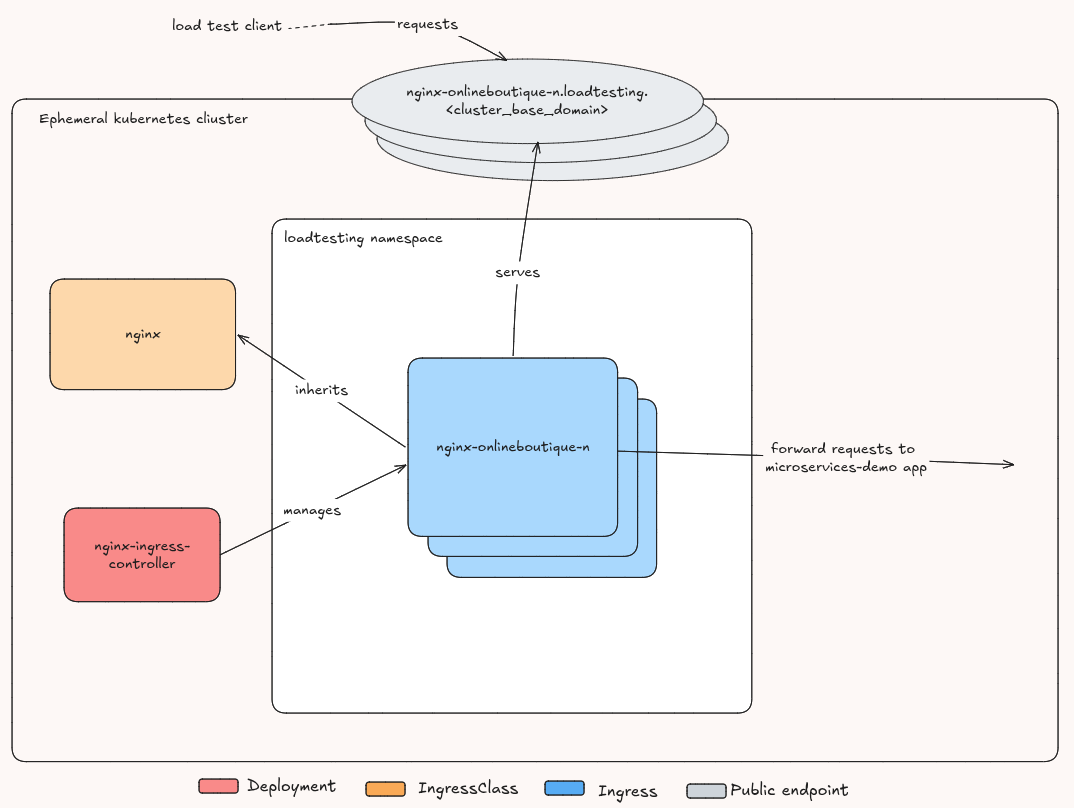
Then the scenario. Defining a perfect test scenario is a never-ending quest, as you will always be torn between one that is closest to real life and one that is simple enough to only show what this kind of test is actually about: the behavior of the target under load. We aimed for the middle ground, so the scenario is neither bulk-sending a single request nor mimicking reality:
- Several different flows are defined,
addToCart,browseProduct,viewCart,checkout… each consisting of one or several HTTP requests sent to the target. - Each flow gets a weight based on how likely it is to happen for an average customer on an online shop.
browseProducthas a weight of 10,addToCarta weight of 2. - For each iteration, meaning one complete scenario execution by a virtual user, a random flow is selected and executed, the ones with a higher weight being more likely to be chosen.
- Envoy Gateway is targeted first for a set duration, then after a five-minute delay the other reverse proxy is targeted by the same scenario for the same duration.
That last point is a compromise we made knowingly. Running both proxies in parallel would have been closer to a fair fight, but it would also have doubled the resource demand and pushed the cluster's scaling capabilities into the measurement. Sequential runs keep the environment predictable at the cost of not testing them under identical instantaneous conditions.
The run, and the numbers
The results below come from a single scenario applied to both Envoy Gateway 1.9.1 and Ingress NGINX Controller 1.15.8, in the Chainguard build, with k6 1.4.0 generating the load:
- Scenario duration: 1h
- Peak requests per second: 5000
- Ramp step: 500 RPS every 90s
- Virtual users: 5000, with k6 allowed to scale up to 7500 if 5000 were not enough to sustain the target rate
In other words: 15 minutes of gradual ramping followed by 45 minutes holding 5000 RPS, twice, once per proxy.
From the reverse proxy side:
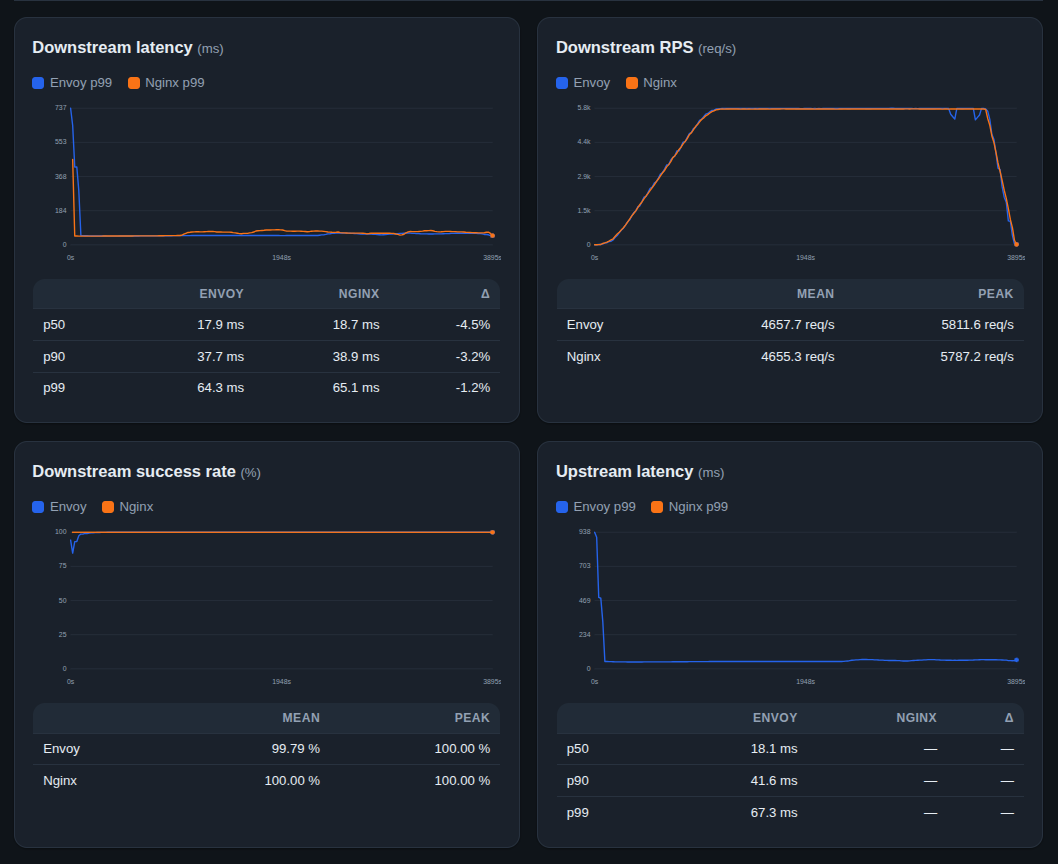
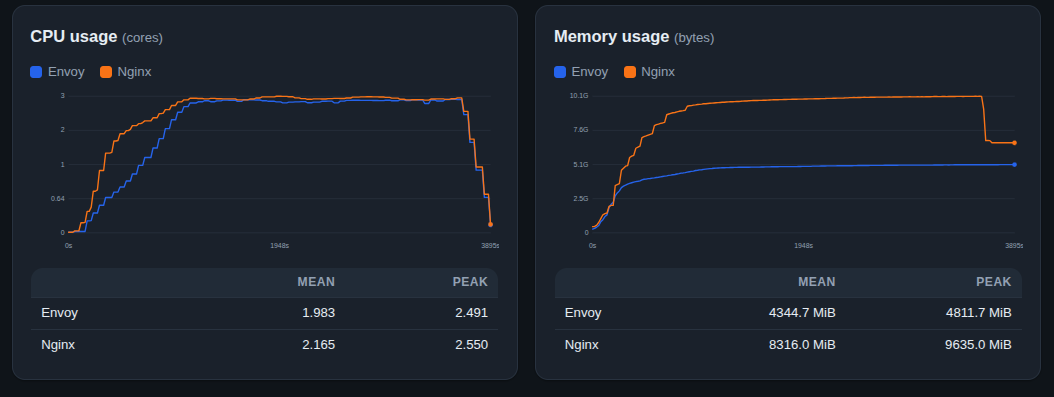
| Metric | Envoy | NGINX | Δ (Envoy vs NGINX) | Better |
|---|---|---|---|---|
| Downstream latency (p99) | 64.3 ms | 65.1 ms | -1.2 % | Envoy |
| Downstream RPS | 4657.7 req/s | 4655.3 req/s | +0.1 % | Envoy |
| Downstream success rate | 100.00 % | 100.00 % | = | Envoy = NGINX |
| Upstream latency | 67.3 ms | - | ||
| CPU usage | 1.983 | 2.165 | -8.4 % | Envoy |
| Memory usage | 4344.7 MiB | 8316.0 MiB | -47.8 % | Envoy |
The headline is not a knockout, and that is exactly the result we were looking for. On the two metrics our SLOs are written against, latency and throughput, the two proxies are indistinguishable: 0.8 ms apart at p99 and 2.4 requests per second apart on throughput. Calling either of those a win would be reading noise as a signal.
Where they genuinely differ is memory. Under the same load, Envoy Gateway averaged 47.8% less of it, a little under half. CPU went the same direction but far less dramatically, 8.4% lower. Since we are not publishing replica counts here, read those two rows as a relative comparison between the proxies under identical load rather than as absolute per-pod figures.
Then there is the success rate row, which is the one number that looked wrong.
The mean value for the Envoy downstream success rate at 99.79% (from the “Downstream Success Rate” graph above) is due to a small drop at startup, for a reason we have not identified yet, and that drop lands before k6 sends its first request. Scoped to the window where the scenario is actually running, Envoy's success rate is thus 100.00%.
The client side tells a slightly different story:
| Metric | Envoy scenario | NGINX scenario |
|---|---|---|
| HTTP req duration p99 | 0.1 ms | 0.1 ms |
| HTTP request rate | 5198.7 req/s | 5206.4 req/s |
| HTTP failure rate | 0.00 % | 1.67 % |
| Checks success rate | 100.00 % | 99.99 % |
| Iterations completed | 9,352,729 | 9,352,739 |
The first two rows are the ones that validate the test: the rig delivered essentially the same load to both targets, within 8 requests per second and 10 iterations of each other across roughly 9.35 million iterations. Whatever the differences below, they are not an artifact of one proxy having been sent more traffic than the other.
The bottom two rows are more interesting, because they point the opposite way to the proxy-side table. From k6's perspective, Envoy failed nothing at all while NGINX failed 1.67% of requests. We can explain the Envoy direction, the startup drop above. We cannot yet explain the NGINX one. The hypothesis we would put money on is that these are connection-level failures that never became requests NGINX could count, since a proxy has no way to record what it never accepted, but we have not verified that and it stays a hypothesis.
What this test doesn't tell you
A benchmark you can't state the limits of isn't worth much, so:
- This is one run, not a mean. Every number above comes from a single execution of the scenario. Repeating it and averaging would almost certainly move the figures, and the two we are calling parity, latency and throughput, are close enough that they could move in either direction. The memory gap is large enough that we would expect it to survive repetition. The 1.2% latency delta is not.
- NGINX upstream latency is missing on purpose. Ingress NGINX doesn't natively expose it, and making it available would have cost time we chose to spend elsewhere. It means the upstream row is Envoy-only and not a comparison.
- The client and the proxies are not measuring the same thing. The two tables disagree on failure rates in both directions. That is a genuine gap in our understanding of the data, not a footnote we resolved.
- The scenario is mid-fidelity by design. Weighted flows against a demo shop are more honest than a single request in a loop and considerably less honest than replaying your traffic. If your request mix looks nothing like an online shop, expect your own numbers to differ.
- The proxies ran sequentially. Neither was measured while competing with the other for the same nodes at the same instant.
Equal performance, half the memory
When a project you depend on gets a retirement date, the fear is very concrete: absorbing a performance regression you did not choose, on behalf of customers who did not choose it either, and spending the following quarter explaining it.
That is not what happened. On the metrics we are held to, Envoy Gateway matched NGINX, and it did so while using roughly half the memory. A forced migration that costs nothing in latency and gives capacity back is about as good an outcome as a forced migration gets.
The other thing we got out of this is the rig, and I suspect it will outlast the numbers. Results age quickly, a version bump on either side could reshuffle that table, but a pipeline that spins up a cluster, runs a weighted scenario at 5000 RPS against whatever you point it at, ships the metrics somewhere durable and then deletes itself is reusable indefinitely. The next Envoy Gateway release, the next implementation we get curious about, the next time somebody asks "but what does it do at peak?", we already know how to answer.
If you have run something similar and landed on different numbers, particularly if you can explain that NGINX client-side failure rate better than we can, I would genuinely like to hear about it.