
This post is about abusing Prometheus in the name of security.
At some point in their Kubernetes adoption, our customers inevitably find themselves needing to bring their clusters under their vulnerability management program. Unfortunately, those policies often predate their Kubernetes usage, so when it comes time to get a handle on their vulnerabilities, it isn’t always clear how to reason whether the new environment satisfies the old requirements (or whether it actually needs to, but that’s another discussion).
The natural starting point for many organizations is to measure the vulnerabilities in their clusters and attempt to fit that information into their existing vulnerability management frameworks. We agree that security should be a day 1 concern, so we aim to provide vulnerability and other security metrics by default for every cluster we run. Making the data available is the first step, but, in doing so, we found ourselves having to improvise a bit in order to support fleet-wide security observability at a larger scale.
This post is a technical dive into one of the components supporting our security monitoring capabilities, with a wholehearted acknowledgment that there is still plenty of room for improvement in this space.
We’ve written in the past about using open source security tools to secure Kubernetes clusters and that we build additional capabilities and abstractions on top of them to make them easier to manage, monitor, and adopt into meaningful security processes. Trivy is currently at the heart of the stack, with Trivy Operator performing vulnerability and configuration scanning of workloads in the cluster and producing reports that we can feed back to the rest of our platform ecosystem.
A big player in that ecosystem is Prometheus. We use Prometheus and Alertmanager for our day-to-day operations monitoring, and we believe keeping security processes closely aligned with operations has a number of benefits for both. Symbiosis aside, Prometheus support has become so ubiquitous that it’s often the most practical way for our customers to consume data about their clusters. That demand for data increasingly includes security metrics. In keeping security close to operations, encapsulating vulnerability data in Prometheus metrics has also shown to be a convenient way to ship CVEs and other security data to whatever SIEMs, dashboards, or alerting backends might be waiting.
Generally, we find re-using Prometheus to be A Good Thing™. So we built the starboard-exporter to expose metrics for those (formerly Starboard, now Trivy Operator) reports, threw it into our clusters, and started scraping.
I’m happy to report that the number of vulnerabilities in the average Giant Swarm management cluster is well within the capabilities of a single exporter. In addition, we run a limited number of almost exclusively Go services, which thus far haven’t been particularly needy when it comes to their vulnerability management demands.
Our customers, however, run much larger and more exciting environments. While a single exporter – given a dozen or so gigabytes of memory – could expose all of the metrics for some of the larger clusters under our management, all that data takes a long time to scrape. At a certain point, collection starts to time out, and the data can change within the duration of a given scrape.
All that is a long way of saying we want to expose security information in Prometheus, but we felt like having a zillion metrics in a single exporter didn’t make sense. So, we decided to spread the metrics out across multiple exporters and let Prometheus figure out the rest.
The idea was simple: deploy N copies of the exporter, take those zillion metrics, and have each of N exporters expose, on average, 1 zillion / N of them. I figured I could hash each report and assign them to shards based on the hash.
At a high level, the process might be:
So I set to work making that a reality.
The first problem was that until this point, the exporter had been shipped as a Deployment, for which Kubernetes created a ReplicaSet. By design, replicas in a Kubernetes ReplicaSet have no idea which replica they are. For sharding to work, each exporter instance would need to be able to predictably differentiate itself from its peers. Unfortunately, there’s no information directly exposed to a Pod about how many siblings it has or about which unique replica it is within the set. Pods in a Deployment are assumed to be interchangeable, and Pods that have meaningful states should be managed instead by StatefulSets.
I came up with three possibilities to help my Pods find their place in the world:
Although one could argue that my exporters were now stateful in that they needed some state of the world in order to make reconciliation decisions, I reasoned this state existed only during a single pod’s lifespan, and the pods were still interchangeable.
Additionally, when I sat down to think about the logic necessary to implement the leader-based approach, I decided it was a. probably more heavyweight than necessary, and b. much more likely that I would mess it up and just make more work for myself.
I decided the best approach was to make each instance aware of its own Service Endpoints. It added complexity, but without introducing new failure domains. It also maintained the semantics of using a Deployment versus a StatefulSet, and I liked that it would reuse the discovery mechanism of its downstream consumers. Prometheus would also be watching those endpoints via a Service Monitor, meaning the exporter’s reconciliation logic would be based on the same source of truth Prometheus would use to find it in the first place.
The solution that took shape looked something like this:
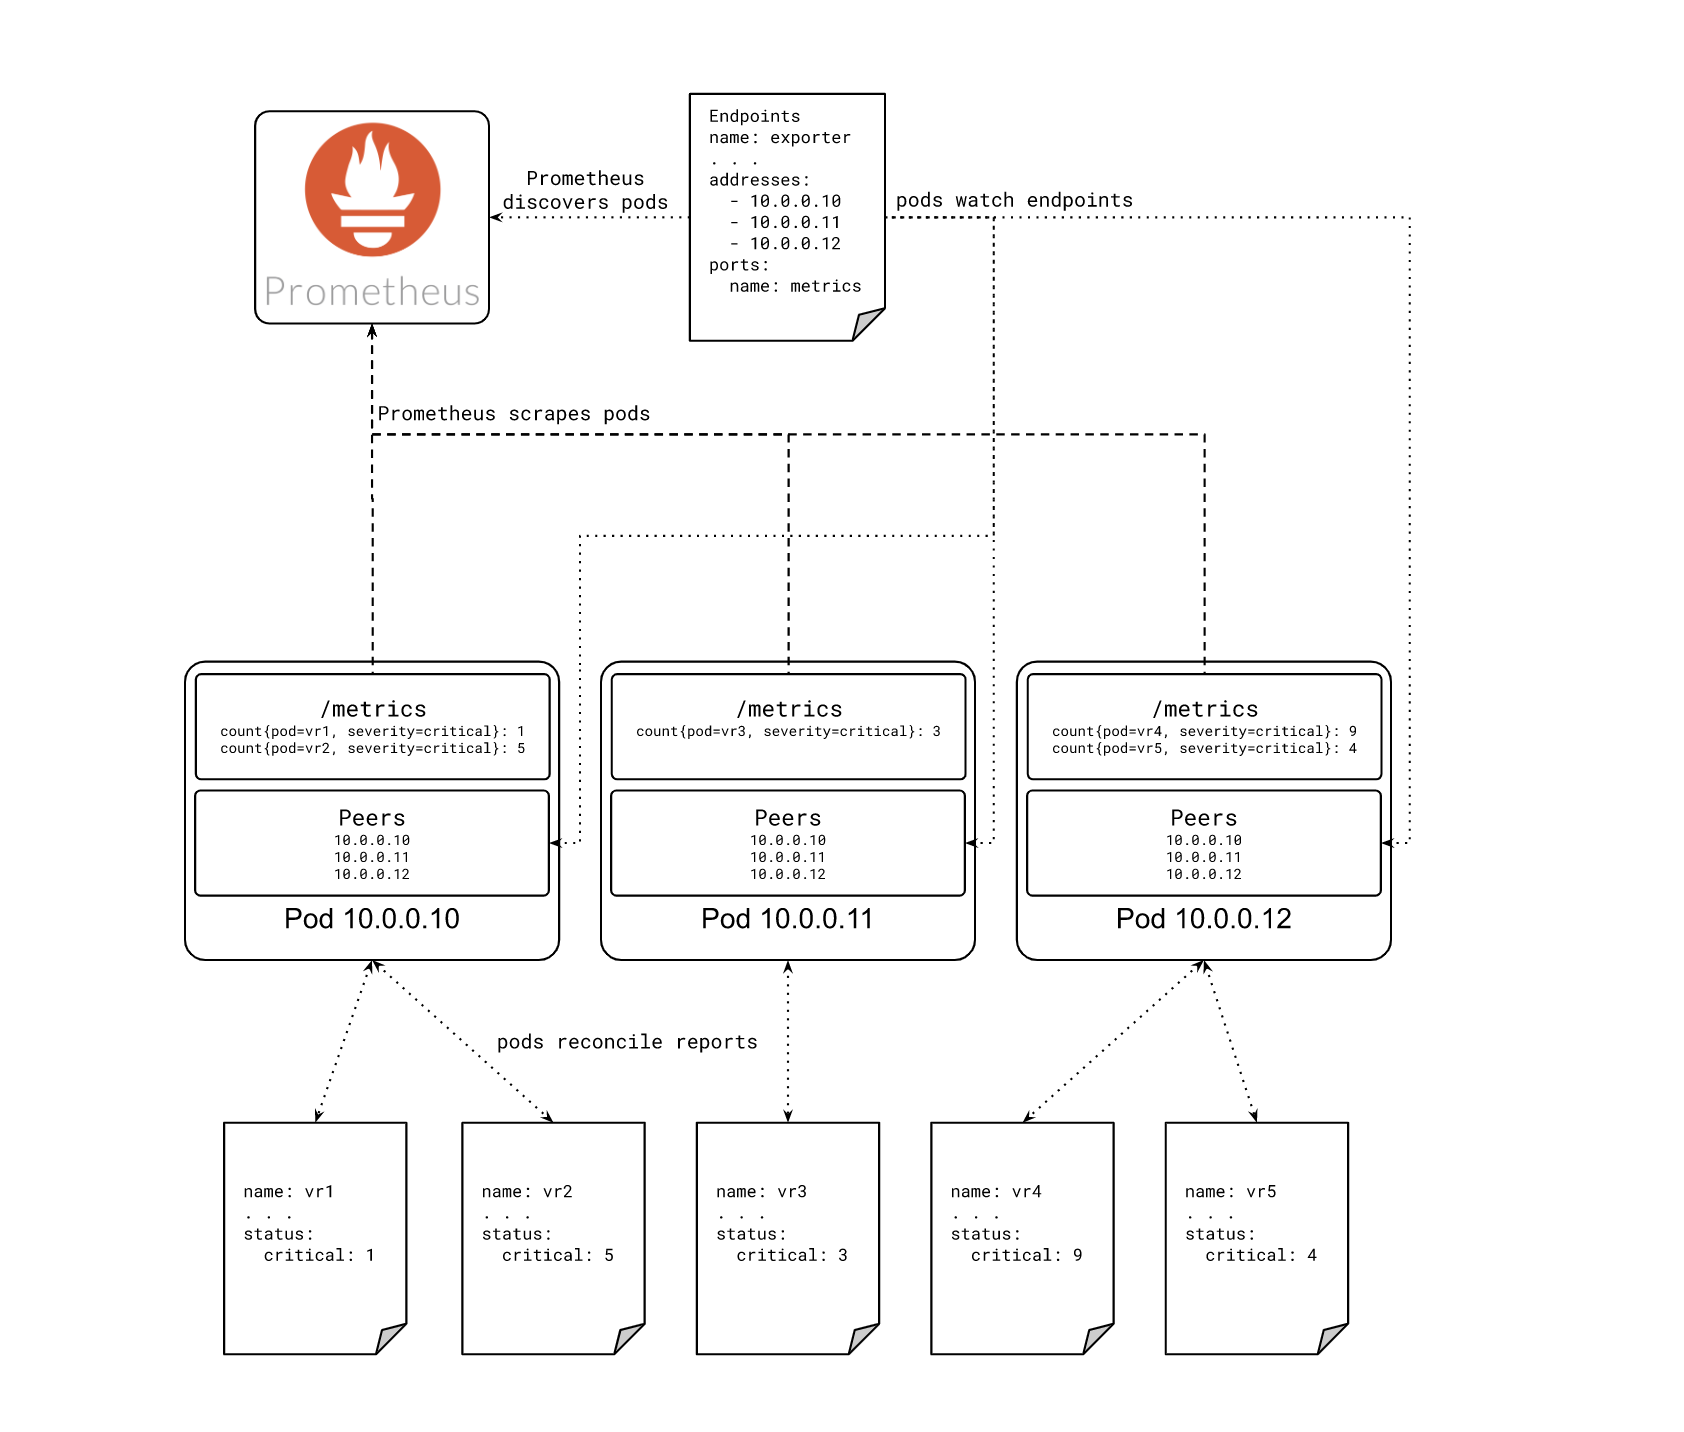
To shard security metrics across our exporters, we create a consistent hash ring, where the members of the ring are the individual exporter instances in our service. Each instance creates its own informer to capture changes to the service endpoints and keep the hash ring up to date. The ring is shared among all the respective controllers for each report type, which use it to determine whether or not to expose metrics for an incoming report.
First, we initialize a hash ring from the very helpful buraksezer/consistent library:
package main

import (
   "fmt"
   "sync"

   "github.com/buraksezer/consistent"
   "github.com/cespare/xxhash/v2"
)

type hasher struct{}

func (h hasher) Sum64(data []byte) uint64 {
   // Other hash functions can be used here instead.
   return xxhash.Sum64(data)
}

type ShardHelper struct {
   PodIP            string
   ServiceName      string
   ServiceNamespace string
   mu               *sync.RWMutex
   ring             *consistent.Consistent
}

func main() {

   consistentCfg := consistent.Config{
       PartitionCount:    97,
       ReplicationFactor: 20,
       Load:              1.25,
       Hasher:            hasher{},
   }

   consistentHashRing := consistent.New(nil, consistentCfg)

   mutex := sync.RWMutex{}

   shardHelper := &ShardHelper{
       PodIP:            "10.0.0.10",
       ServiceName:      "my-service",
       ServiceNamespace: "my-namespace",
       mu:               &mutex,
       ring:             consistentHashRing,
   }
}
This code has been simplified, and placeholder values have been added for the sake of readability. We also introduce an object called a ShardHelper, which contains everything our controllers will need to actually use this hash ring. The other parameters passed to the underlying algorithm are described in more detail in the consistent repository, as well as in the Google AI blog post, Vimeo Engineering Blog post, or the original paper if you’re feeling motivated.
However, note the PartitionCount set here to 97. This number is the number of partitions into which incoming objects will be distributed. It is also the maximum number of members of the ring. I chose 97 as our PartitionCount because – as best I can guess right now – most people probably don’t need more than 97 exporters, so it seemed like a reasonably large prime number to use as our initial maximum. If you need more than 97 instances, please get in touch so we can share in your great pain and make this value configurable. 😅
With our new (empty) hash ring created, we next wire up an Informer to update the members when our Service changes.
   // Create and start the informer which will keep the endpoints in sync in our ring.
   stopInformer := make(chan struct{})
   defer close(stopInformer)

   // Create a separate logger for our asynchronous updates.
   informerLog := ctrl.Log.WithName("informer").WithName("Endpoints")

   // Create a dynamic Kubernetes client to use.
   dc, err := dynamic.NewForConfig(ctrl.GetConfigOrDie())
   if err != nil {
       log.Error(err, "unable to set up informer")
       os.Exit(1)
   }

   // We are only interested in our own Service.
   listOptionsFunc := dynamicinformer.TweakListOptionsFunc(func(options *metav1.ListOptions) {
       options.FieldSelector = "metadata.name=" + shardHelper.ServiceName
   })

   // Use our namespace and expected endpoints name in our future informer.
   factory := dynamicinformer.NewFilteredDynamicSharedInformerFactory(dc, 0, shardHelper.ServiceNamespace, listOptionsFunc)

   // Construct an informer for our Service endpoints.
   informer := factory.ForResource(schema.GroupVersionResource{
       Group: "", Version: "v1", Resource: "endpoints"}).Informer()

   // Set handlers for new/updated endpoints. In both cases, we will just call updateEndpoints().
   handlers := cache.ResourceEventHandlerFuncs{
       AddFunc: func(obj interface{}) {
           updateEndpoints(obj, nil, shardHelper, informerLog)
       },
       UpdateFunc: func(oldObj, newObj interface{}) {
           // In the future, we might need to re-queue objects which belong to deleted peers.
           // When scaling down, it is possible that metrics will be double reported for up to the reconciliation period.
           // For now, we'll just set the desired peers.
           updateEndpoints(newObj, oldObj, shardHelper, informerLog)
       },
   }

   informer.AddEventHandler(handlers)

   // Start the informer.
   go informer.Run(stopInformer)
In the snippet above, we do several things.
First, we set up a channel so that we can stop the informer when the pod shuts down. We also create a new logger so that messages from the asynchronous calls to update our hash ring are distinct from the logs emitted elsewhere in the exporter.
We then create the actual informer, which will watch the endpoints of the Service with our service name, and set up event handlers to be called whenever there is an update to the Service endpoints. Here we make use of a suite of helper functions, starting with updateEndpoints(), which I will omit from this post for the sake of brevity. These helper functions accept the incoming update, determine which endpoints were added or removed since the previous state, and update the hash ring accordingly. The logic is interesting, but doesn’t make for great reading material, so if you’d like to examine updateEndpoints() and its assistants for yourself, feel free to peruse the actual code in the repository.
With the informer keeping our member list up to date, we can now rely on the consistent hash ring to assign each report to a shard, and that shard to an owner. Recall that this exporter watches several types of reports created by Starboard, and has a separate controller for each type. The full controller code isn’t worth reproducing in this post, but each one performs essentially the same task: watch a particular type of report, read information from the incoming reports, and expose that information as a Prometheus metric. For demonstration purposes, and because it is the 'noisiest' of the reports, I will focus on the VulnerabilityReport controller.
The current VulnerabilityReports reconciliation logic looks like this – we will unpack it below. I’ve made a few small modifications for clarity.
func (r *VulnerabilityReportReconciler) Reconcile(ctx context.Context, req ctrl.Request) (ctrl.Result, error) {

   // The report has changed, meaning our metrics are out of date for this report. Clear them.
   deletedSummaries := VulnerabilitySummary.DeletePartialMatch(prometheus.Labels{"report_name": req.NamespacedName.String()})
   deletedDetails := VulnerabilityInfo.DeletePartialMatch(prometheus.Labels{"report_name": req.NamespacedName.String()})

   shouldOwn := r.ShardHelper.ShouldOwn(req.NamespacedName.String())
   if shouldOwn {

       // Try to get the report. It might not exist anymore, in which case we don't need to do anything.
       report := &aqua.VulnerabilityReport{}
       if err := r.Client.Get(ctx, req.NamespacedName, report); err != nil {
           if apierrors.IsNotFound(err) {
               // Most likely the report was deleted.
               return ctrl.Result{}, nil
           }

           // Error reading the object.
           r.Log.Error(err, "Unable to read report")
           return ctrl.Result{}, err
       }

       // Publish summary and CVE metrics for this report.
       r.publishImageMetrics(report)

       // Add a label to this report so any previous owners will reconcile and drop the metric.
       report.Labels[controllers.ShardOwnerLabel] = r.ShardHelper.PodIP
       err := r.Client.Update(ctx, report, &client.UpdateOptions{})
       if err != nil {
           r.Log.Error(err, "unable to add shard owner label")
       }
   } else {
       if deletedSummaries > 0 || deletedDetails > 0 {
           r.Log.Info(fmt.Sprintf("cleared %d summary and %d detail metrics", deletedSummaries, deletedDetails))
       }
   }

   return utils.JitterRequeue(controllers.DefaultRequeueDuration, r.MaxJitterPercent, r.Log), nil
}
There’s actually not a whole lot going on there, and the sharding logic is among the smallest pieces.
When the controller gets a new report to reconcile, the first thing we do is clear any existing metrics for that report. If a report has changed, our metrics are probably stale anyway, and the logic necessary to diff against an existing metric is both much more complicated and not supported by the Prometheus client API, so we simply assume a new report means new data and drop whatever we had before. This also drastically simplifies what comes next.
We now have a report to potentially reconcile and are ready to use our hash ring to determine if the current instance of the exporter should handle it or not. First, we consult our ShardHelper, which under the hood queries the hash ring for the owner of the incoming report and determines if our pod is that owner.
If it isn’t, this reconciliation loop is effectively done. If the exporter cleared any metrics for this report, we log that, and then re-queue the report to be reconciled again at some point in the future.
If our pod is the owner, then our job isn’t quite done yet. After retrieving the full report from the API server, we parse it and expose the report data as metrics according to the exporter’s configuration. The exporter’s purpose is now fulfilled, but we also apply a label to the report so that any previous owners will drop the report from their metrics. This isn’t strictly necessary, but it tightens feedback loops for folks watching these metrics. It is frustrating to deploy a shiny new version of your application just to see the number of vulnerabilities in it double. Without the label, metrics might be shown by multiple instances of the exporter for up to the maximum re-queue period, so we try to cut that down, admittedly at the expense of an extra API call.
Great! Our exporter now has an identity, which it uses to be selective about which reports it will process. If other instances are added to or removed from the Service, the local state will be updated, and the exporter will react to the changes in the cluster, adding or removing metrics as needed. The exporter deployment can now scale based on need, and scrape times are kept low by limiting the amount of data to be scraped from any particular exporter instance. Once the metrics are collected, vulnerability information can be shown in dashboards, or used for reporting, alerting, or ticket creation.
This exporter makes a number of tradeoffs and has some other implementation details which may be useful or interesting to certain readers. I won’t take it personally if you’ve had enough already and skip to the ending.
Some exciting twists in the development of this exporter (so far) have been:
We’ve been happily torturing Prometheus this way for several months now, and it has diligently performed as intended. Stay tuned for the possible future post in which I outline just how badly this came back to bite us, but, for the time being, we find relatively few clusters actually need to run multiple instances, and this is working well for large and small clusters alike. This solution serves as the foundation for many interesting customer use cases, and we are happy to see that it has also proven valuable for others in the community.
We anticipate that the future of vulnerability scanning in Kubernetes will look quite different than it does today; open source security tooling will continue to mature, and a general shift towards SBOM-based methods may make pod scanning obsolete. Our security platform will follow these and other developments, and we plan to be more involved in bringing open source security capabilities to the community. But for now, the great burden of reporting the world’s CVEs falls to trusty old Prometheus.
Poor, poor Prometheus.


We empower platform teams to provide internal developer platforms that fuel innovation and fast-paced growth.
GET IN TOUCH
General: hello@giantswarm.io
CERTIFIED SERVICE PROVIDER
No Comments Yet
Let us know what you think